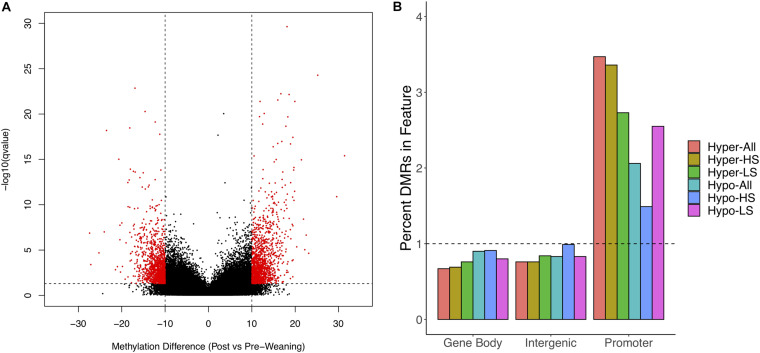
FIGURE 1.
Differential methylation in post- versus pre-weaning PBMCs. (A) Volcano plot of methylation difference against –log10 (q-value). Red dots indicate significant differentially methylated regions (DMRs). (B) Enrichment of hypomethylated and hypermethylated DMRs for All, HS, and LS pigs in gene features. Horizontal line indicates expected relative proportion of DMRs in feature if no enrichment (i.e., 1). HS, high stress; LS, low stress.

