Figure 3.
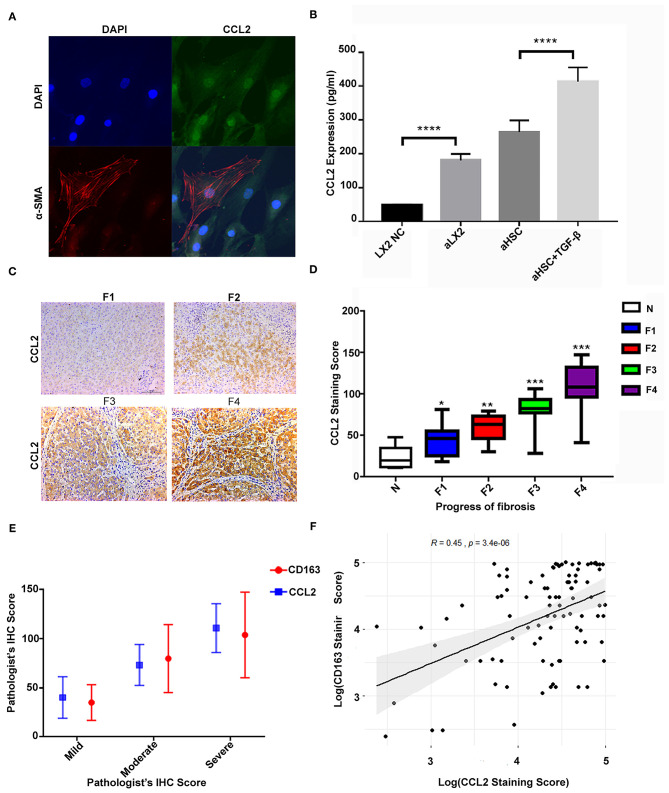
The high level of CCL2 in aHSCs was associated with CD163+ macrophage infiltration and increased with liver fibrosis progression. (A) The primary aHSCs are typically fusiform and express the activation marker α-SMA, together with a high expression of CCL2 protein. (B) The aHSCs secrete high levels of CCL2 as compared to LX2, which is further enhanced by TGF-β stimulation (LX2 vs. TGF-β-stimulated LX2, P < 0.001; aHSC vs. TGF-β-stimulated aHSCs, P < 0.001). (C) Representative figures for immunohistochemistry staining of liver tissues with antibody of CCL2. As the degree of liver fibrosis worsened (F1 to F4), the expression of CCL2 increased gradually. (D) Comparison of CCL2 staining score among different fibrotic status. The number of patients for N was 7, F1 was 14, F2 was 12, F3 was 14, and F4 was 41. (E) The correlations between CD163 and CCL2 were explored under different fibrotic degree. (F) A relatively strong correlation was established between M2 macrophage (CD163+) IHC staining score and CCL2 score by scatter plot (R = 0.45, P < 0.05).

