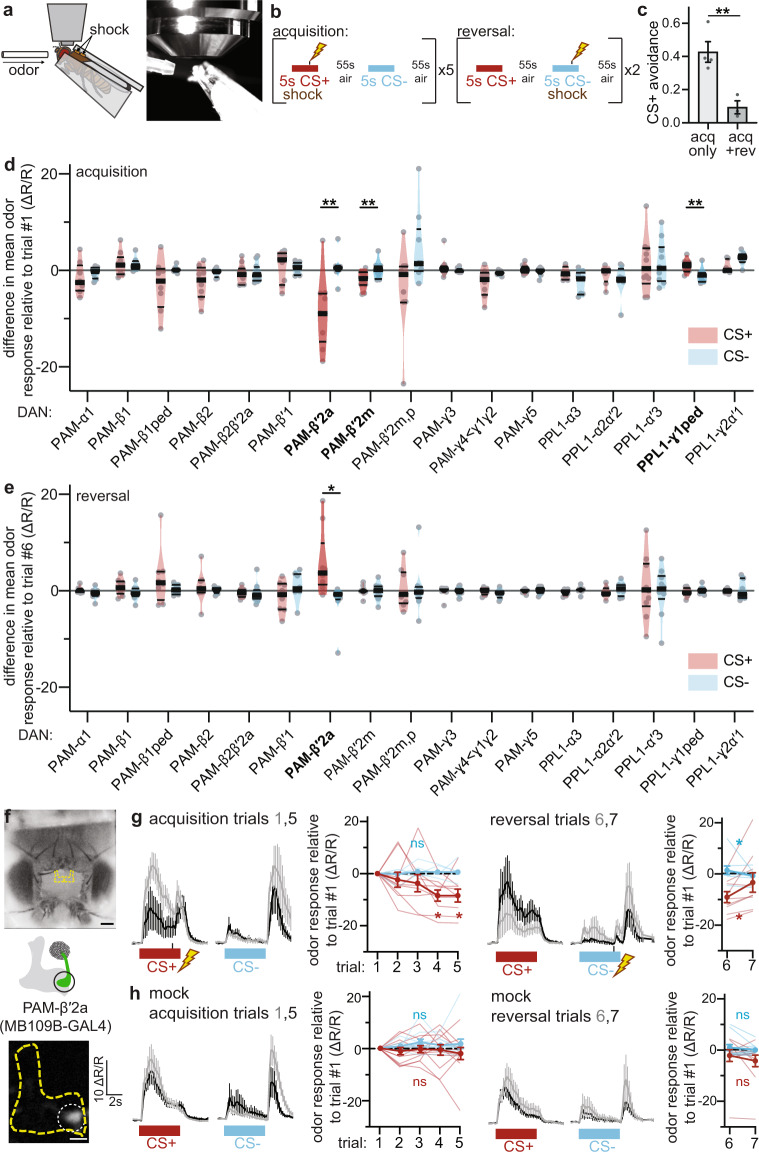
Fig. 1. PAM-β′2a DANs change CS+ odor response during aversive memory acquisition and reversal.
a Experimental setup. Flies are presented with odors and electric shocks while neural activity is recorded using GCaMP6f. b Training paradigm. During acquisition, CS+ odor (maroon) is paired with electric shock, CS− odor (blue) is not. During reversal, shock is omitted during CS+ and instead paired with CS−. c Behavioral validation. Flies conditioned en masse using training paradigm in (b) avoid CS+ after acquisition; avoidance is reduced in flies conditioned with acquisition and reversal. n = 4 and 3 groups of flies. Statistical comparison is by two-tailed unpaired t-test. d DAN imaging screen. The difference in mean Ca2+ response to CS+ and CS− on last versus first acquisition trial. Dots represent data from single flies. Violin plots show range, median (thick line) and quartiles (thin lines). Change in PAM-β′2a, PAM-β′2 m, and PPL1-γ1ped CS+ response is significantly different relative to CS−. n = 8,9,8,8,11,8,9,11,9,11,8,9,8,8,10,9,7 flies. Statistical comparison by two-tailed paired t-test or Wilcoxon matched-pairs signed-rank test. e Same as (d), except for reversal. Change in PAM-β′2a CS+ response relative to CS- during reversal is significantly different. Sample sizes and statistical comparisons as in (d). f Top: fly head and dissection window; scale bar:100 μm. MBs outlined in yellow. Middle: Schematic of PAM-β′2a (green), MB in gray. Bottom: Fluorescence image of PAM-β′2a. Scale bar: 20 μm. ΔR/R scale bar applies to mean fluorescence traces in (g, h). g Neural activity of PAM-β′2a in flies undergoing reversal learning. For each phase, mean fluorescence traces of first (gray) and last (black) acquisition or reversal trial are on the left. On the right, line graphs show CS+ (maroon) and CS− (blue) responses relative to the first acquisition trial for individual flies (thin lines) and group means (thick lines). PAM-β′2a CS+ response decreases during acquisition and increases during reversal. n = 9 flies. Statistical comparison for acquisition and reversal is by repeated-measures two-way ANOVA with Dunnett’s post-hoc test and two-tailed paired t-test, respectively. h Same as (g), but mock conditioning. PAM-β′2a odor response does not change. n = 11 flies. All error bars are mean ± SEM. Statistical comparisons as in (g), n.s. not significant, *p < 0.05, **p < 0.01.

