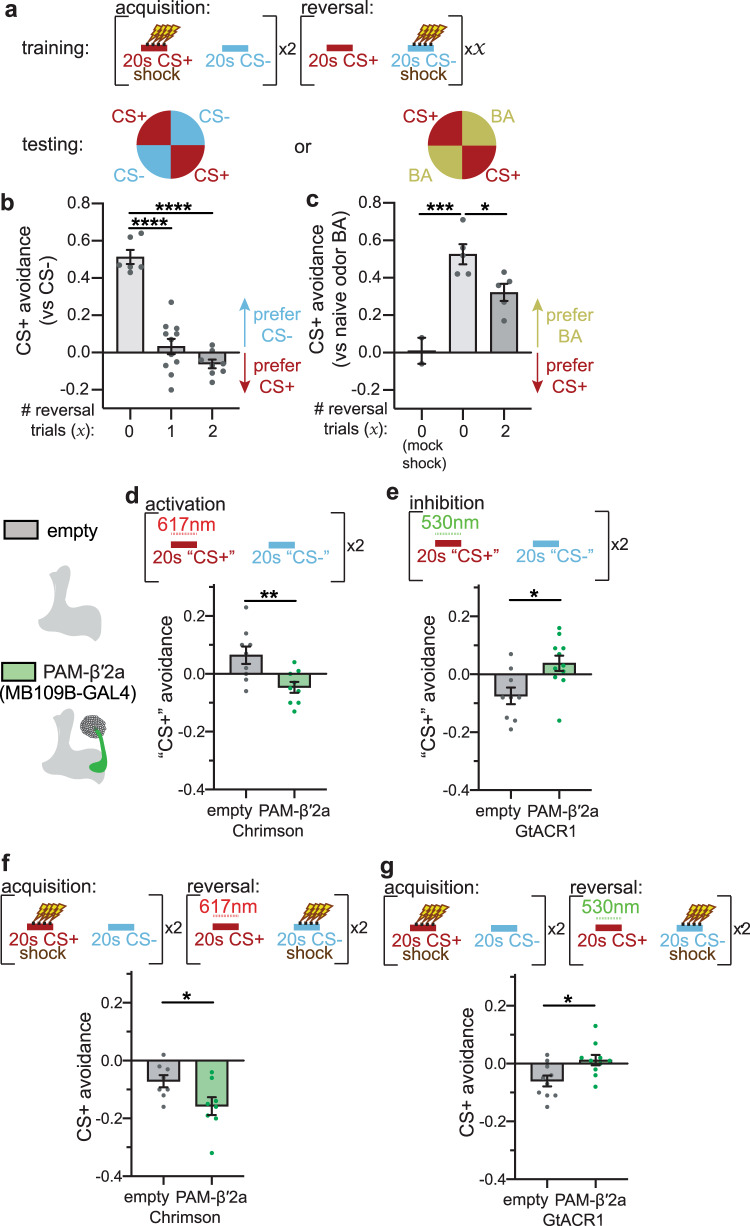
Fig. 2. PAM-β′2a DANs encode reward of shock omission during CS+ presentation during reversal learning.
a Training and testing paradigm for behavioral experiments. During acquisition, CS+ is paired with electric shock, followed by CS− without reinforcement. After the acquisition, flies undergo zero, one or two reversal trials, where the shock is omitted during CS+ and presented with CS−. Flies are then placed in the quadrant arena to quantify odor preference. CS+ versus CS− are used in all behavioral figures other than Fig. 2c. b Flies avoid CS+ after acquisition; this avoidance is reduced for flies that undergo reversal trials after the acquisition. n = 6, 11 and 8 groups of flies. Statistical comparison is by one-way ANOVA with Dunnett’s post-hoc test. c Flies that undergo reversal after acquisition exhibit reduced CS+ avoidance relative to flies that undergo acquisition only. n = 2, 5, and 5 groups of flies. Statistical comparison as in (b). d Left: Schematic of PAM-β′2a and empty-splitGAL4 driver line. Right: Experimental protocol for assessing valence associated with odor when paired with red-light neural activation (“617 nm”) via Chrimson. Flies are exposed to “CS+” paired with red light, followed by “CS−” without light. Flies expressing Chrimson in PAM-β′2a increase preference for “CS+” odor, relative to control flies. n = 9 and 8 groups of flies. Statistical comparison is by two-tailed unpaired t-test. (e) Same as in (d), except using green-light (“530 nm”) for neural inhibition via GtACR1. Flies expressing GtACR1 in PAM-β′2a decrease preference for “CS + ” odor, relative to control flies. n = 9 and 11 groups of flies. Statistical comparison as in (d). f Reversal learning training paradigm. Same protocol as in Fig. 2a, with the addition of red light to activate neurons. Activating PAM-β′2a during CS+ reversal decreases CS+ avoidance relative to genetic controls, indicating enhanced reversal learning. n = 8 and 8 groups of flies. Statistical comparison as in (d). g Same protocol as (f), except using green light to silence neurons. Silencing PAM-β′2a during CS+ reversal impairs reversal learning. n = 10 and 10 groups of flies. Error bars are mean ± SEM. Statistical comparison as in (d), n.s. not significant, *p < 0.05, **p < 0.01, ***p < 0.001, ****p < 0.0001.

