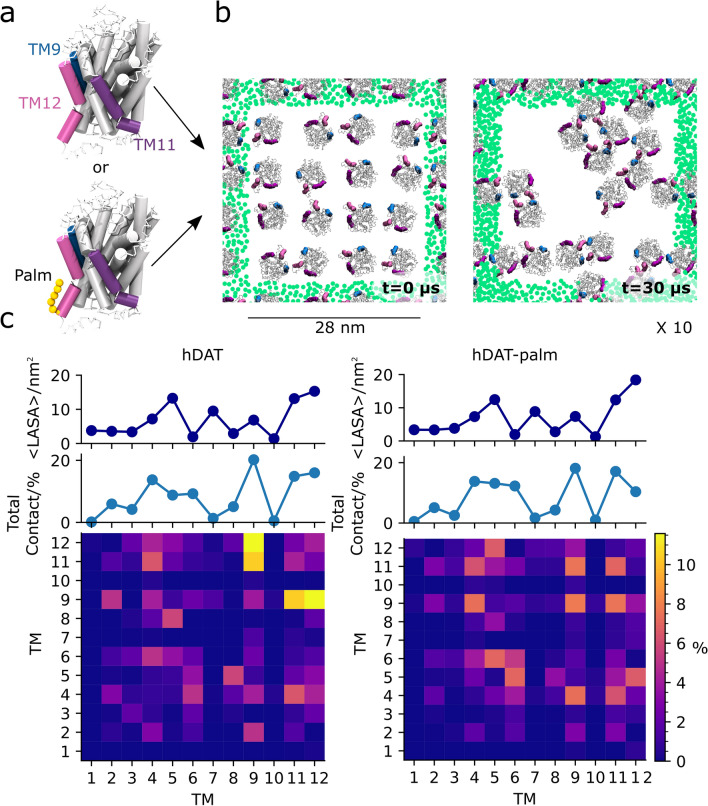
Figure 1.
System setup and interhelical contact maps of hDAT and hDAT-palm excluding the palmitoyl group. (a) The hDAT CG structures with and without a palm group (orange spheres) attached to TM12. Shown in (b) is a top view of one of a system a(top view with respect to the membrane) at 0 µs (left) and after a 30 µs simulation (right). In the two systems 16 hDAT and hDAT-palm molecules were initially equally spaced and randomly orientated with respect to each other in a pure POPC membrane. hDAT and hDAT-palm were simulated for 30 µs and repeated 10 times. Palm, TM9, TM11, and TM12 are highlighted in orange, blue, purple, and magenta, respectively. The green dots represent the GL1 bead of POPC in the nearest periodic images for the system. Illustrated in (c), hDAT (left) and hDAT-palm (right), are the per helix contact maps calculated for all possible dimer pairs. An interhelical contact was considered when any residue in one protomer’s helix was within 7 Å of any residue in the other protomer’s helix (not considering the palm group). The contacts have been normalized by the total number of contacts calculated for the hDAT system. The 1D plot immediately above the contact map illustrates the sum of all TM contacts calculated for each helix given in %. The top 1D plot illustrates the average lipid accessible surface area in nm2 of the different helices in the two systems using a probe of size 0.26 nm. The standard deviations are not visible in the plots due to their small sizes (they vary between 0.23 and 0.71).

