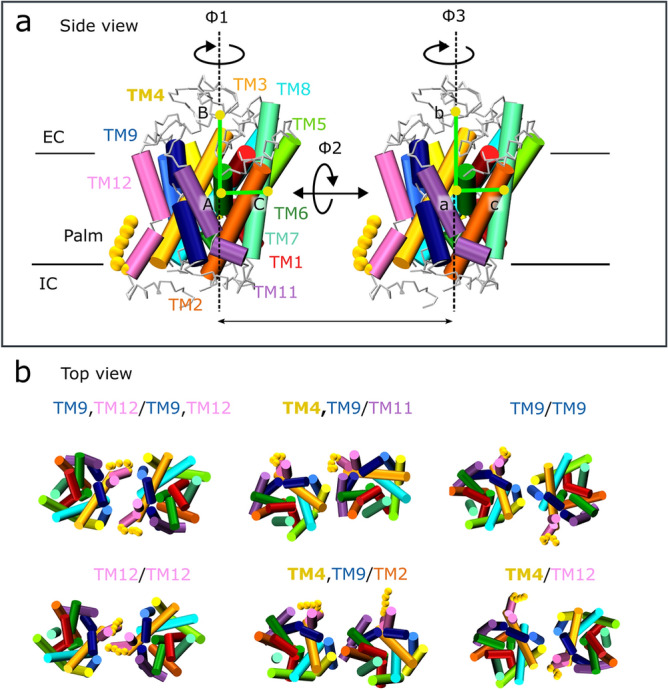
Figure 2.

Dimer cluster comparison between the two systems, hDAT and hDAT-palm. Depicted in (a) is a transmembrane (TM) overview of hDAT shown from the side with respect to the membrane normal. The helices are individually color-coded using the same coloring scheme as applied throughout the article. Highlighted in bold spheres is the palmitoyl group (palm) covalently bound to TM12. The two angles, ϕ1 and ϕ3, are used for describing the individual protomer’s relative orientation. Depicted in (b) are the common top clusters observed in both the hDAT and hDAT-palm simulations, with the exception of the TM12/TM12 dimer, which is only detected 0.1% of the time in the hDAT-palm simulations. For a full view of the representative dimers of all top clusters of the hDAT and hDAT-palm system see Supplementary Fig. S5-6.
