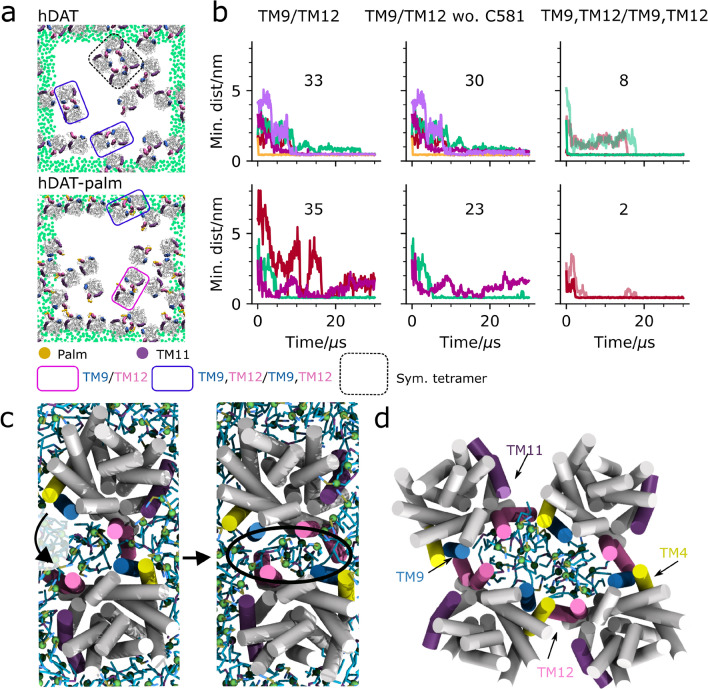
Figure 4.
Dynamics of the TM9/TM12 interface. In (a) the last frame of a single representative repeat simulation is shown for hDAT (MD1, top) and hDAT-palm (MD4, bottom). The last frames for all repeat simulations are supplied in Supplementary Fig S1. Within the pink boxes are TM9/TM12 interfaces and illustrated in the purple box is a symmetrical interface involving both TM9 and TM12 helices, dubbed TM9, TM12/TM9, TM12. Highlighted in the black dotted box is a symmetrical tetramer. The green dots correspond to the GL1 bead in POPC and are depicted for the nearest periodic images to the system. For the single simulation box the dots have been omitted. The helices TM9, TM11, and TM12 are highlighted in blue, purple, and mauve, respectively. Illustrated in (b) is the formation of single TM9/TM12 contacts both considering and not considering Cys581 (wo. Cys581) on which palm is attached in the analysis (the first and second column, respectively). Double TM9,TM12/TM9,TM12 contacts are also monitored for the same representative repeat simulations as depicted in (a) for hDAT (top) and hDAT-palm (bottom)(third column). Each color in the same plot represents a different dimer pair and the total number of dimers across all repeat simulations that form the given interface are noted in the plots. The TM9, TM12/TM9, TM12 interface is further subdivided into two similar color shades representing the minimum distance for each TM9/TM12 helix pair located in the same dimer. The contact plots for the different interfaces across all repeat simulations are supplied in Supplementary Fig. S10-14. In (c) the formation of the symmetrical TM9, TM12/TM9, TM12 interface is shown. It is observed that POPC lipids are associated with the interface. Illustrated in (d) is a close-up of the symmetrical tetramer.

