Figure 5.
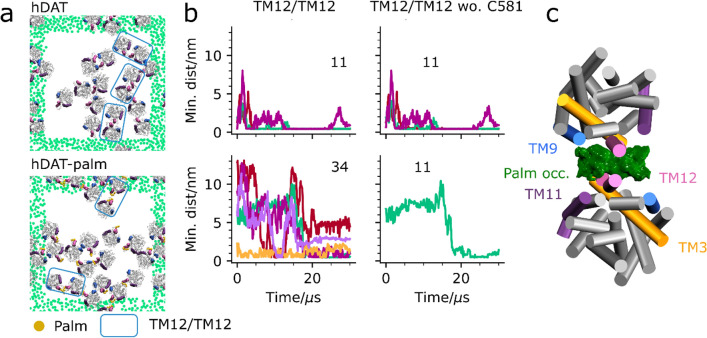
Dynamics of the TM12/TM12 interface. In (a) the last frame of a single representative repeat simulation is shown for hDAT (MD2, top) and hDAT-palm (MD3, bottom). The last frames for all repeat simulations are supplied in Supplementary Fig. S1. Similar interfaces are observed across the two systems involving TM12 on which palm (orange) is attached. Within the blue box a TM12/TM12 interface is observed. The green dots correspond to the GL1 bead in POPC and are shown for the nearest periodic images to the system. For the single simulation box the dots have been omitted. The helices TM9, TM11, and TM12 are highlighted in blue, purple and mauve, respectively. In (b) the formation of single TM12/TM12 contacts both considering and not considering Cys581 (wo. Cys581) on which palm is attached in the analysis. The TM12/TM12 pairs that were monitored were evaluated as being in contact continuously for 500 ns during the course of the simulation. A contact was defined when the minimum distance between TM12 helices was below 7 Å. The contact plots for the different interfaces across all repeat simulations are supplied in Supplementary Fig. S15-17. Shown in (c) is the palm 3D occupancy computed using the Volmap plugin in VMD for all dimers captured in the TM12/TM12 hDAT-palm cluster (cluster 53 in Table 1).

