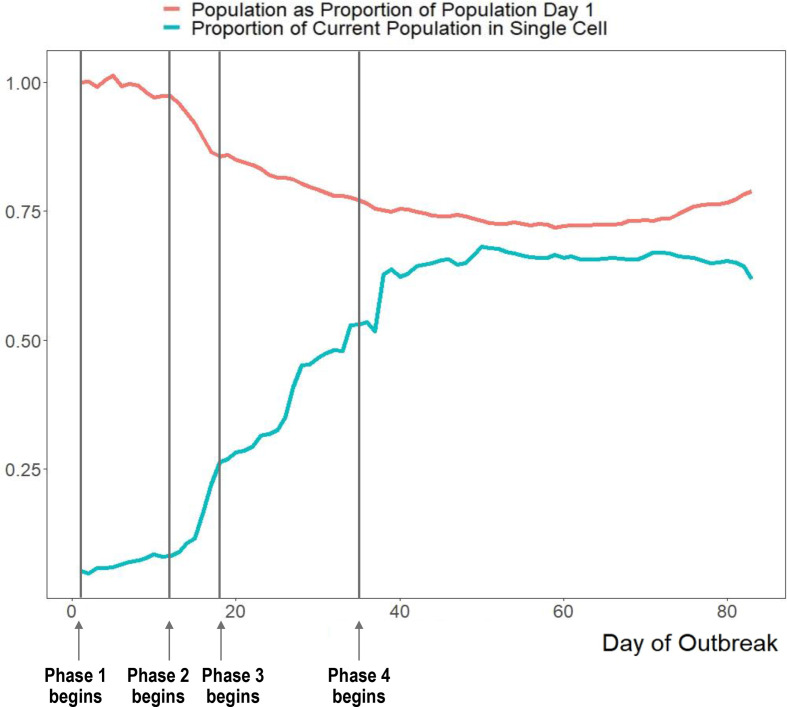
Figure 2.
Change in the total population of the jail and the portion of the population in single-occupancy cells over the course of the outbreak. As depopulation increases, the overall population as a proportion of the population on day 1 of the outbreak decreases. Additionally, the proportion of incarcerated people in single-occupancy cells increases over time. We denote the timing of each intervention phase on the graph. Phase 1: initial outbreak, phase 2: depopulation began, phase 3: increased single celling, phase 4: widespread testing of asymptomatic incarcerated individuals.

