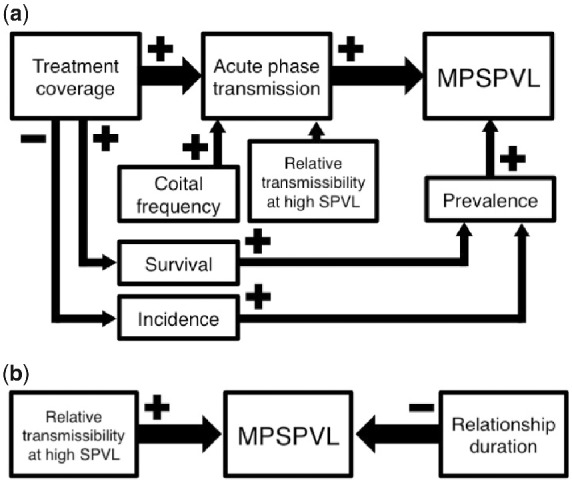
Figure 4.

Causal diagram showing the hypothesized relationships between model factors and (a) MPSPVL change and (b) overall MPSPVL. Arrow size shows strength of the effect. The relative transmissibility at high SPVL refers to the probability of transmission at high VLs. In (a) the plateauing transmission function creates more variability in the proportion of transmissions in the acute phase than does the increasing transmission function. In (b) the increasing transmission function has high transmissibility and subsequently higher MPSPVLs while the plateauing transmission function has lower transmissibility and lower MPSPVLs.
