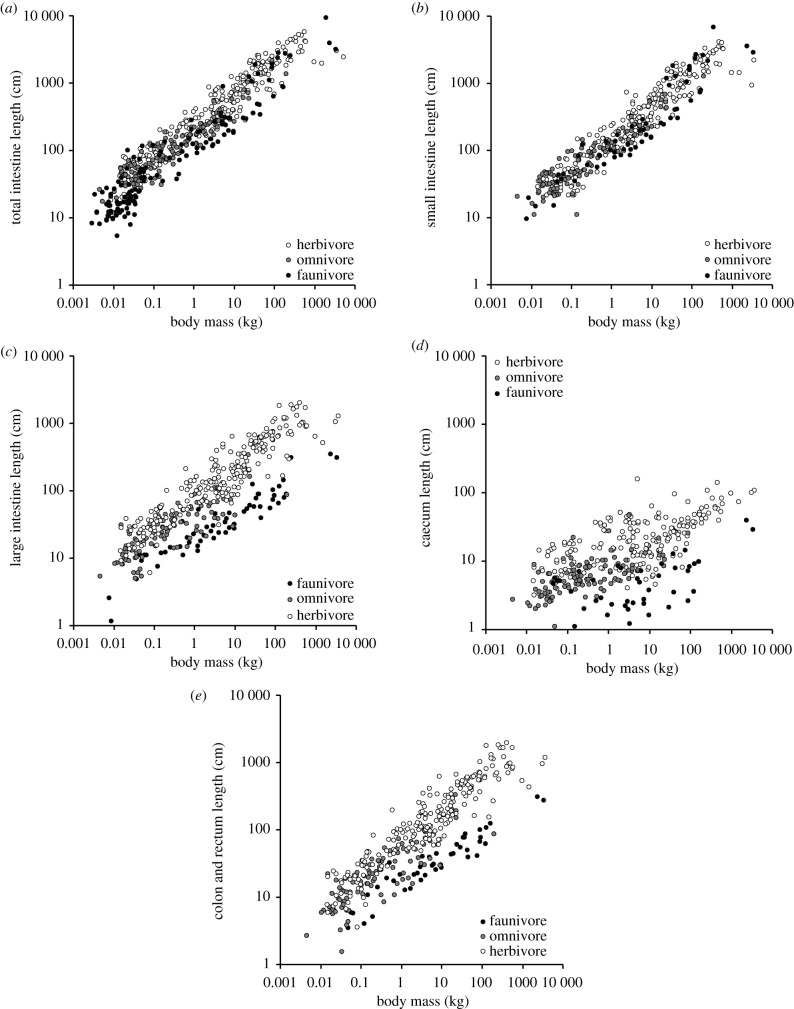
Figure 2.
Relationship of body mass and intestinal length for (a) total intestine (n = 519 species), (b) small intestine (n = 397), (c) large intestine (caecum, colon and rectum) (n = 387), (d) caecum (n = 352), (e) colon and rectum (n = 370) by trophic groups. For statistics, see electronic supplementary material, table S4. Note that for statistics, %faunivory was used as a continuous variable, whereas it is depicted for different groups here, using a 10 and 90% threshold to separate herbivores, omnivores and faunivores.

