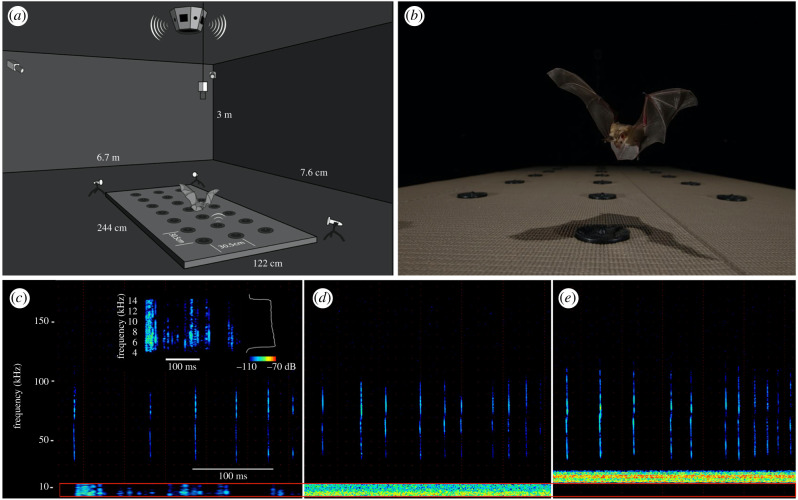
Figure 1.
(a,b) Experimental set-up. (a) Bats hunted individually in an anechoic flight room. We broadcast noise treatments from an omnidirectional speaker mounted on the ceiling to parse mechanism of noise disturbance. (b) Bats were trained to localize a prey cue playback from 1 of 21 speakers. (c–e) Spectrograms (kHz × time; colour indicates intensity, see legend in 1c inset) of pallid bat sonar emissions in (c) ambient—no noise broadcast, (d) overlapping noise—band-limited 4–14 kHz noise that overlapped the spectrum of the prey cue (indicated by the red outlined bar in all three panels), and (e) non-overlapping noise—band-limited 14–24 kHz noise that was spectrally distinct from the prey cue and the bat's sonar. The inset panel in (c) shows the spectrogram (kHz × time) of the prey signal (4–14 kHz) with its associated power spectrum (kHz × dB) with sound intensity measured in relative dB. Panel (c) also includes an overlay of the prey signal and the two spectrograms were combined in Photoshop to visualize the signal that was presented to echolocating bats. The power spectra of the noise stimuli are not presented; we used band-passed white noise with approximately equal energy across frequencies. (Online version in colour.)

