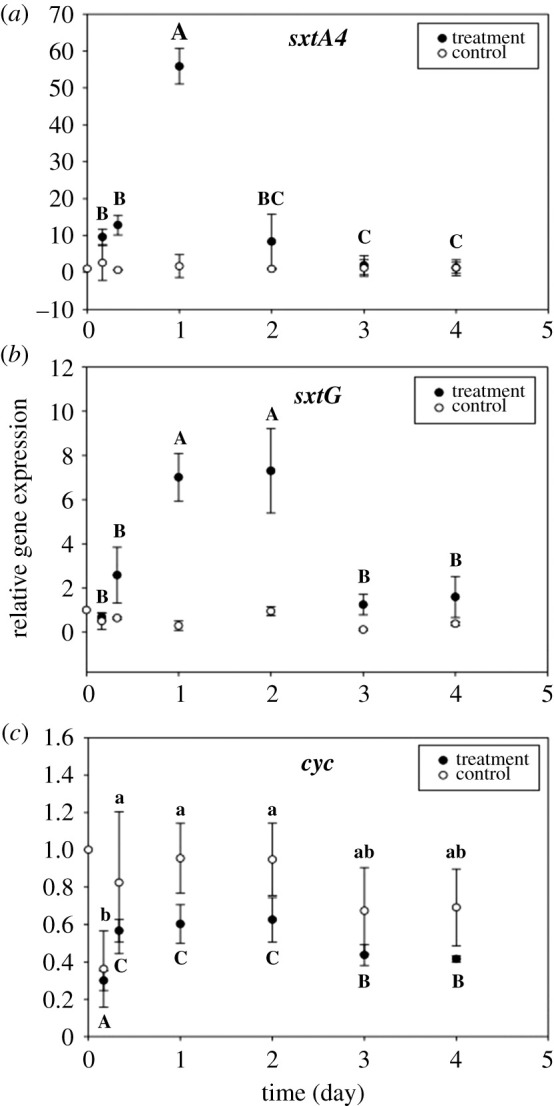
Figure 2.

Relative expression of STX genes (sxtA4 and sxtG, a,b) and cell growth-related gene (cyc, c). The reference gene (lbp) was used to normalize the gene expression levels. Letters above/below bars represent significant differences among mean values of groups in the control (lowercase) and treatment (uppercase). Error bars represent ± 1 standard deviation of the mean (n = 4).
