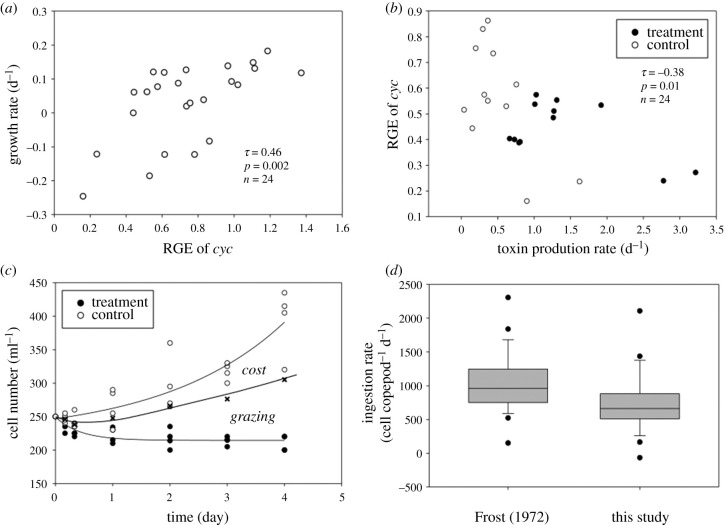
Figure 3.
Relative gene expression (RGE) of growth-related gene (cyc) versus cell growth rate in the control (a), and between toxin production rate (μtox) and growth rate calculated by the regression of figure 3a (b), the changes in cell concentration owing to fitness cost and grazing (c), and copepod ingestion rates (d) during the grazing assay. In (c), the difference between the upper and middle line is the cell loss owing to the defence fitness cost, and the difference between the middle and lower line represents the cell loss owing to the grazing. (d) compares copepod ingestion rates estimated by the traditional grazing equation [52] versus the modified ingestion rate that accounts for the reduction in cell growth rate owing to toxin production (this study). Boxplot represents the second and third quartile of data, line in the box is the median, dots are outliers and the error bar represents the range of observations. Lines are regression fits.

