Figure 1.

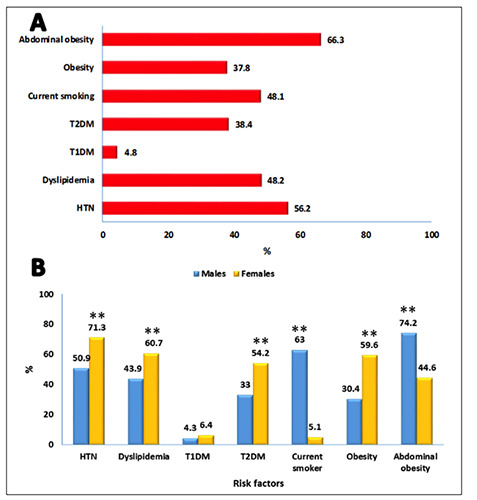
Distribution of traditional cardiovascular risk factors for the whole population (A) and according to gender (B). Percentages are from the total valid entries into the electronic CRFs. ** P value <0.001 versus the other group.

Distribution of traditional cardiovascular risk factors for the whole population (A) and according to gender (B). Percentages are from the total valid entries into the electronic CRFs. ** P value <0.001 versus the other group.