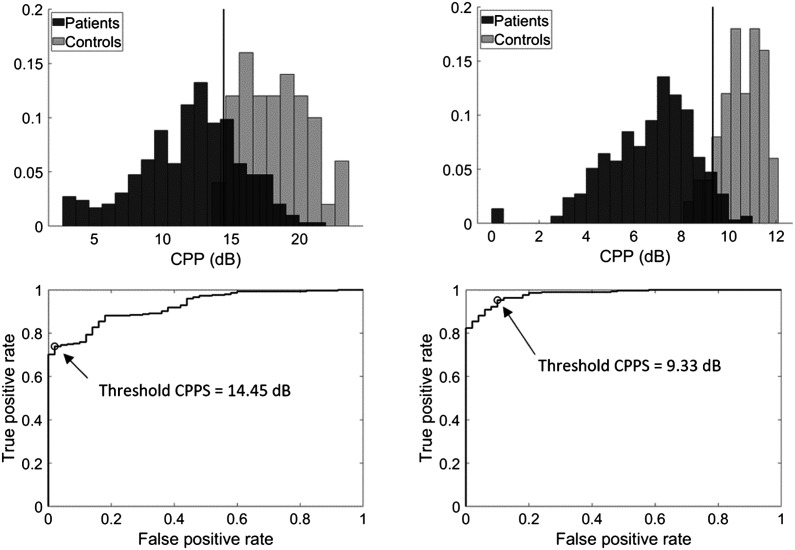
Figure 3.
Top row: Histogram of Praat-based smoothed cepstral peak prominence (CPPS) values from patients with voice disorders (dark) and vocally healthy individuals (light) for sustained vowels (left) and continuous speech (right). Total bin counts sum to 1 within each group. Vertical lines indicate thresholds derived from the maximum Youden's index. The “positive” class is the patient group. Bottom row: Receiver operating characteristic curves plotting true positive versus false positive rates at various CPPS thresholds for sustained vowels (left) and continuous speech (right). Open circles indicate the threshold given by the maximum Youden's index.

 This work is licensed under a