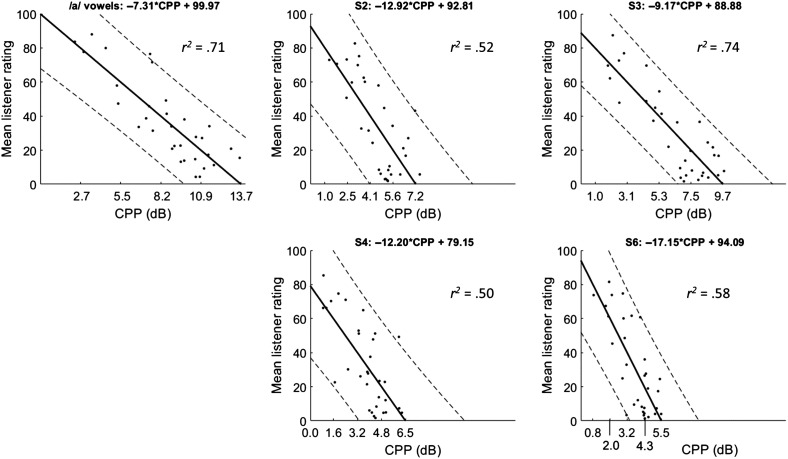
Figure 4.
Correlations between Analysis of Dysphonia in Speech and Voice–based cepstral peak prominence (CPP) and listener rating of overall severity for each speaking task. Solid lines indicate best-fit regression line, and dashed lines show 95% prediction intervals. The x-axis tick labels show the CPP values corresponding to each y-axis tick label based on the regression line.

 This work is licensed under a