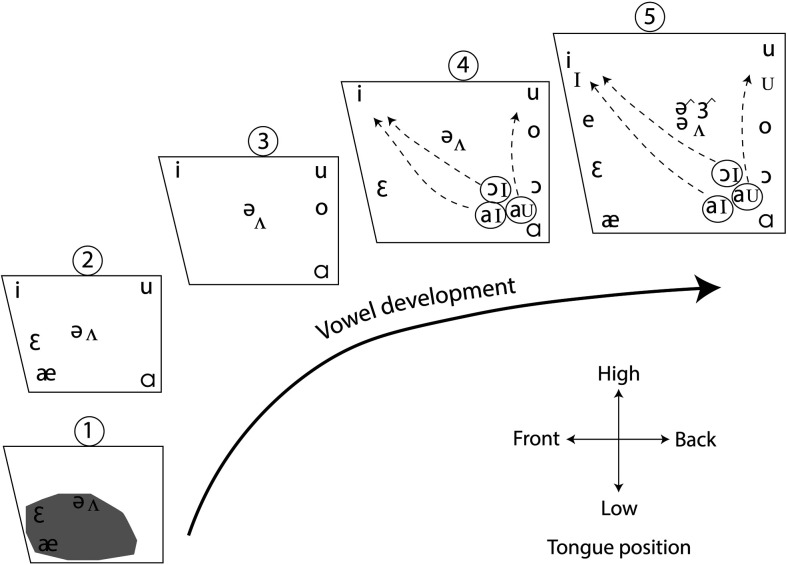
Figure 7.
Diagrammatic representation of typical vowel development in children. The numbers correspond generally to age in years, but there is substantial individual variation. Based on patterns described by Donegan (2013), Otomo and Stoel-Gammon (1992), and Stoel-Gammon and Herrington (1990).

