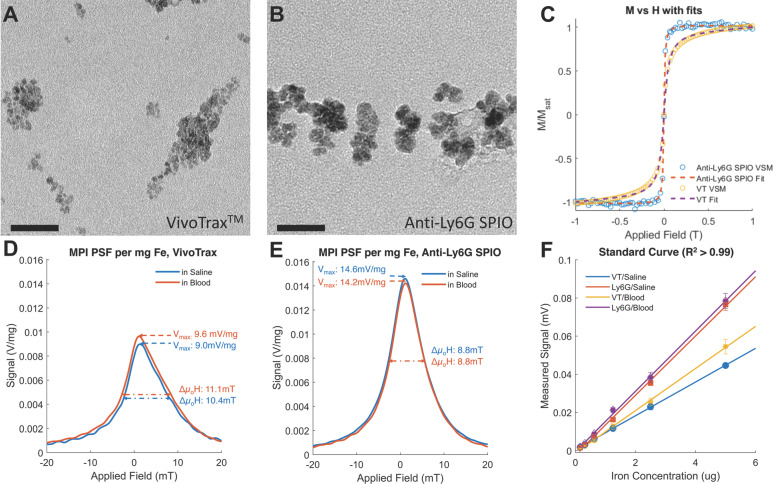
Figure 2.
Magnetic characterization of the anti-Ly6G SPIOs compared to VivoTraxTM (VT). Representative transmission electron microscopy (TEM) images (scale bar = 50 nm) were taken of both (A) VT with core diameter = 5.4 ± 1 nm and (B) anti-Ly6G SPIOs with core diameter = 14 ± 2 nm. (C) The magnetization curve of VT and the anti-Ly6G SPIOs as measured in a VSM were fit to a log-normal diameter distribution. Anti-Ly6G SPIOs had a mean magnetic diameter (Dv) of 14.8 nm, with a log-normal standard deviation (σln d) of 0.5. VT had (Dv) = 9.8 nm and σ = 0.2. We used a custom arbitrary waveform relaxometer (AWR) to measure the MPI point spread function (PSF) of both samples in saline and in blood. Representative PSFs are shown in (D) for VT and (E) for the anti-Ly6G SPIOs. Note the signal change in the PSF of VT, with the change in signal being significant (p < 0.05). In comparison, anti-Ly6G SPIOs showed stable behavior in both solvents (change in signal was not significant (p = 0.7 > 0.05). (F) A standard curve of MPI signal was taken versus iron concentration for all particles in mouse blood and in saline, with mean and standard error given over n = 3 samples (with 8 acquisition repeats averaged per sample). Both particles show linearity with concentration in both solvents (R2 > 0.99). The anti-Ly6G SPIOs showed significantly better resolution (p < 0.01) and sensitivity (1.8 ± 0.3 times better, with p < 0.01) than VivoTraxTM. VivoTraxTM showed a significant (p < 0.01) change in sensitivity (V/g) in different media, while the anti-Ly6G SPIOs did not (p > 0.05). This standard curve was also repeated in the scanner and is included in Figure 3. (H: magnetic field; M: Magnetization; MPI; magnetic particle imaging; PSF: point-spread function; SPIO: superparamagnetic iron oxide; VT: VivoTraxTM).

