Figure 3.
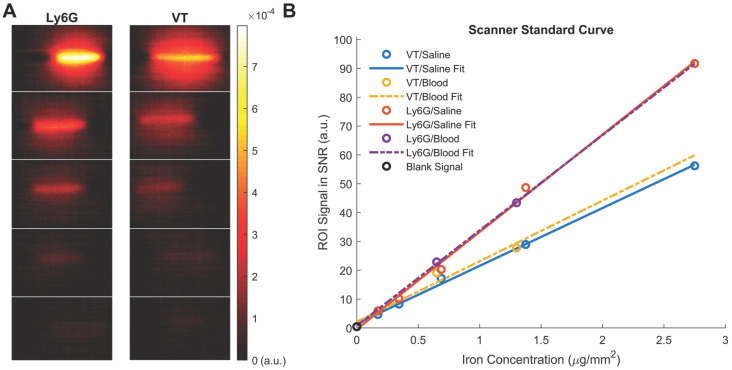
Standard Curve of the anti-Ly6G SPIOs and VivoTraxTM (VT) in our Field-Free Line Scanner. (A) the images of the standard curve for anti-Ly6G SPIOs and VT in saline are shown in linear heat scale scaled to the maximum signal between both curves (FOV = 4.1 x 6.2 cm2, scan time = 37s). Note the increased conspicuity of anti-Ly6G SPIOs when compared to VivoTraxTM (B) The standard curves in saline (given as the sample SNR averaged from the 5 pixels by 5 pixels center of each sample), alongside standard curves in blood. The linear fits to each particle and solvent pair are mostly good (R2 > 0.99), except for VT in blood (R2 = 0.85) - this can be attributed to experimental error in the sample at 0.7 μg mm-2. Note the similarity to Figure 2F, with the sensitivity of the anti-Ly6G SPIOs being 1.7 ± 0.5 times better than that of VivoTraxTM. (SNR: signal-to-noise ratio; SPIO: superparamagnetic iron oxide; VT: VivoTraxTM).

