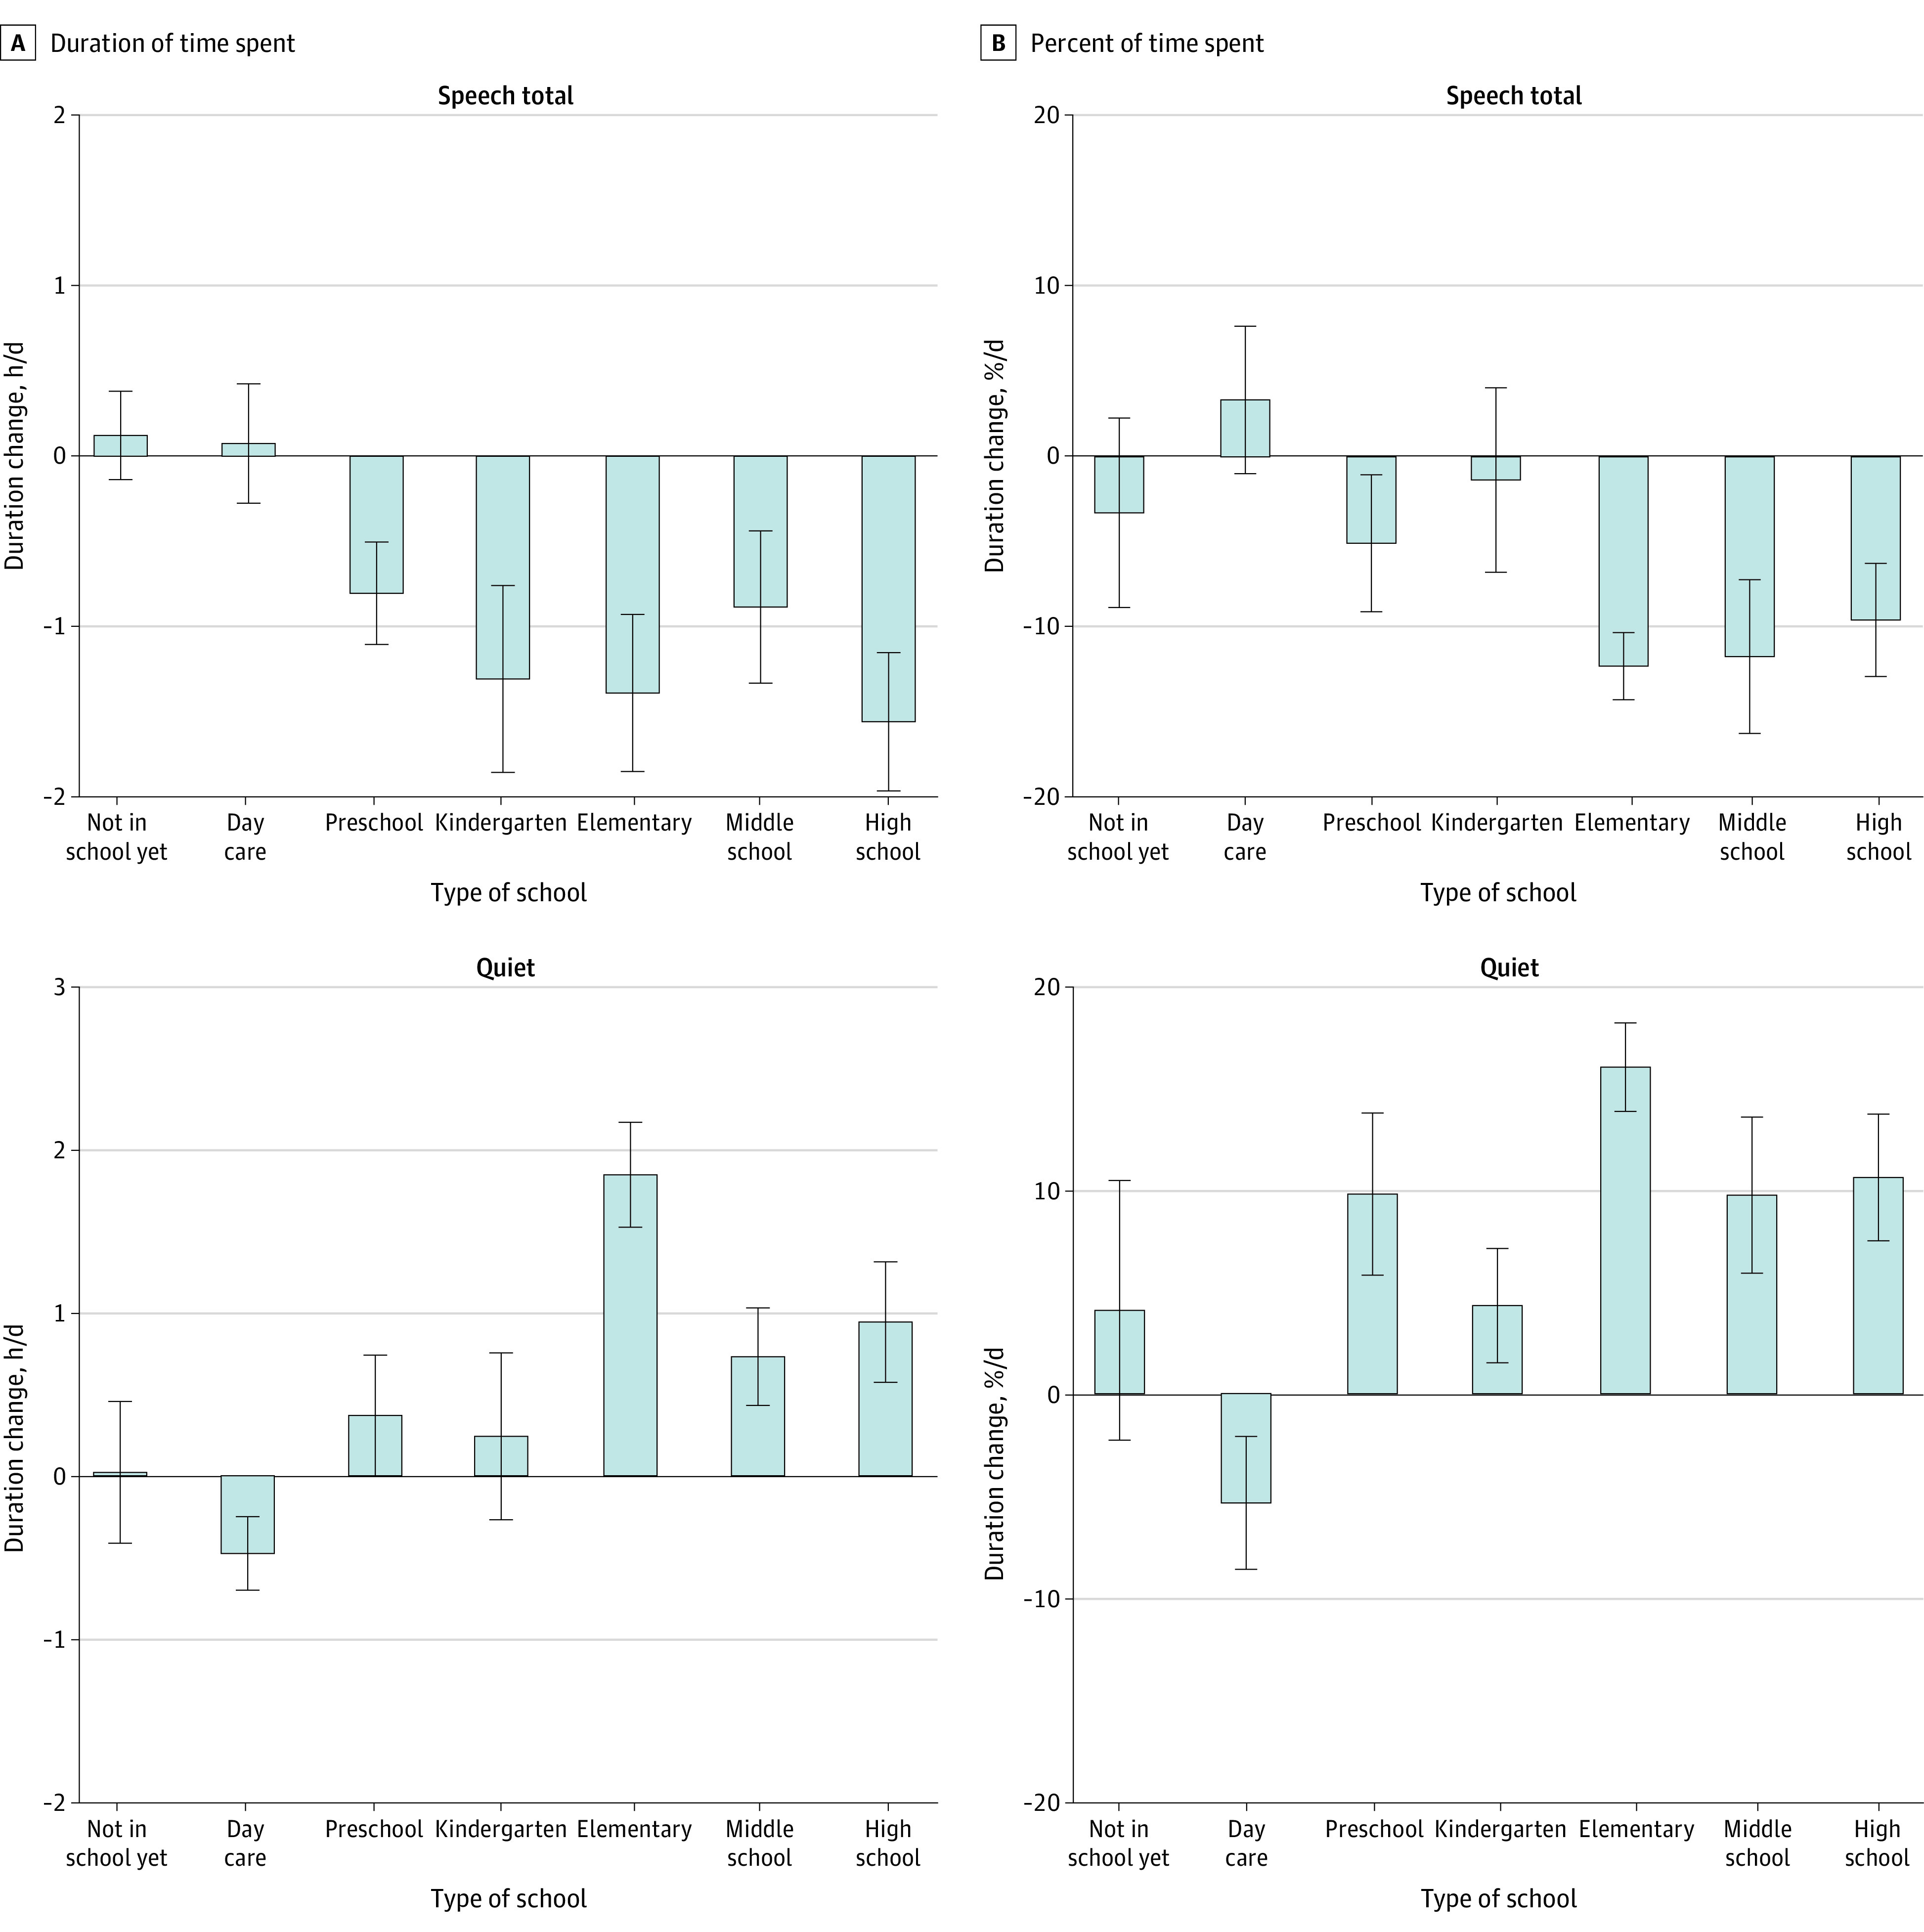
Figure 3. Mean Change in Total and Percent of Time Spent in Speech Categories (Speech-in-Noise + Speech) and the Quiet Category for Children Grouped by Type of School Attended.

For school-aged children, time spent in speech decreased (COVID-19 period × school interaction: F6,45 = 2.50, P = .008; Cohen f = 0.53 for daily hours and F6,45 = 2.89, P = .02; Cohen f = 0.56 for percentage of time) and time spent in quiet increased (COVID-19 period × school interaction: F6,45 = 6.20, P < .0001; Cohen f = 0.87 for daily hours and F6,45 = 4.85, P = .0007; Cohen f = 0.75 for percentage of hours). The time period includes pre–COVID-19 to peri–COVID-19. Error bars indicate standard deviations. COVID-19 indicates coronavirus disease 2019.
