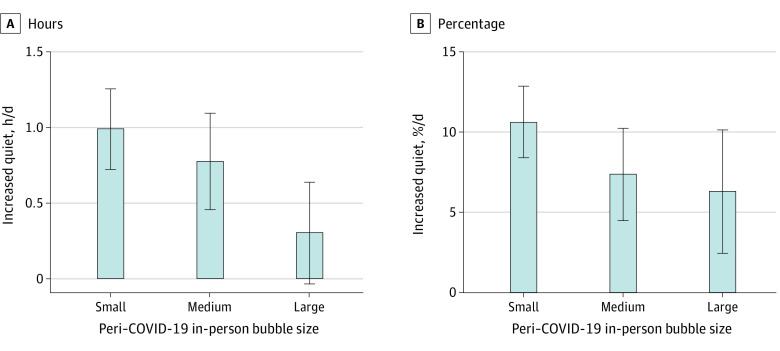
Figure 4. Mean Increase in Hours or Proportion of Sounds Categorized as Quiet for Children’s In-Person Bubbles During the Coronavirus Disease 2019 (COVID-19) Lockdown.
Increased quiet was most prominent for children with small bubbles (estimate [SE] = −0.15 [0.072] daily hour per increase of bubble by 1 person; F1, 45 = 4.31, P = .04; Cohen f = 0.31) and percentage of time (estimate [SE] = −1.12% [0.50%] per person; F1,45 = 4.89, P = .03; Cohen f = 0.31) with no significant change in hours of quiet for children in large bubbles (0.31-hour difference [95% CI, −0.45 to 1.07], t[9] = 0.91, P = .39; Cohen d = 0.29) or percentage of quiet (6.29% hour-per-day difference [95% CI, −2.54 to 15.12], t[9] = 1.64, P = .14; Cohen d = 0.55). Bubble size: small (0-3 people), medium (4-7), or large (8-15). Error bars indicate standard deviations.

