
Figure 2. Treatment Effect Plots for Bone Metastasis Count.
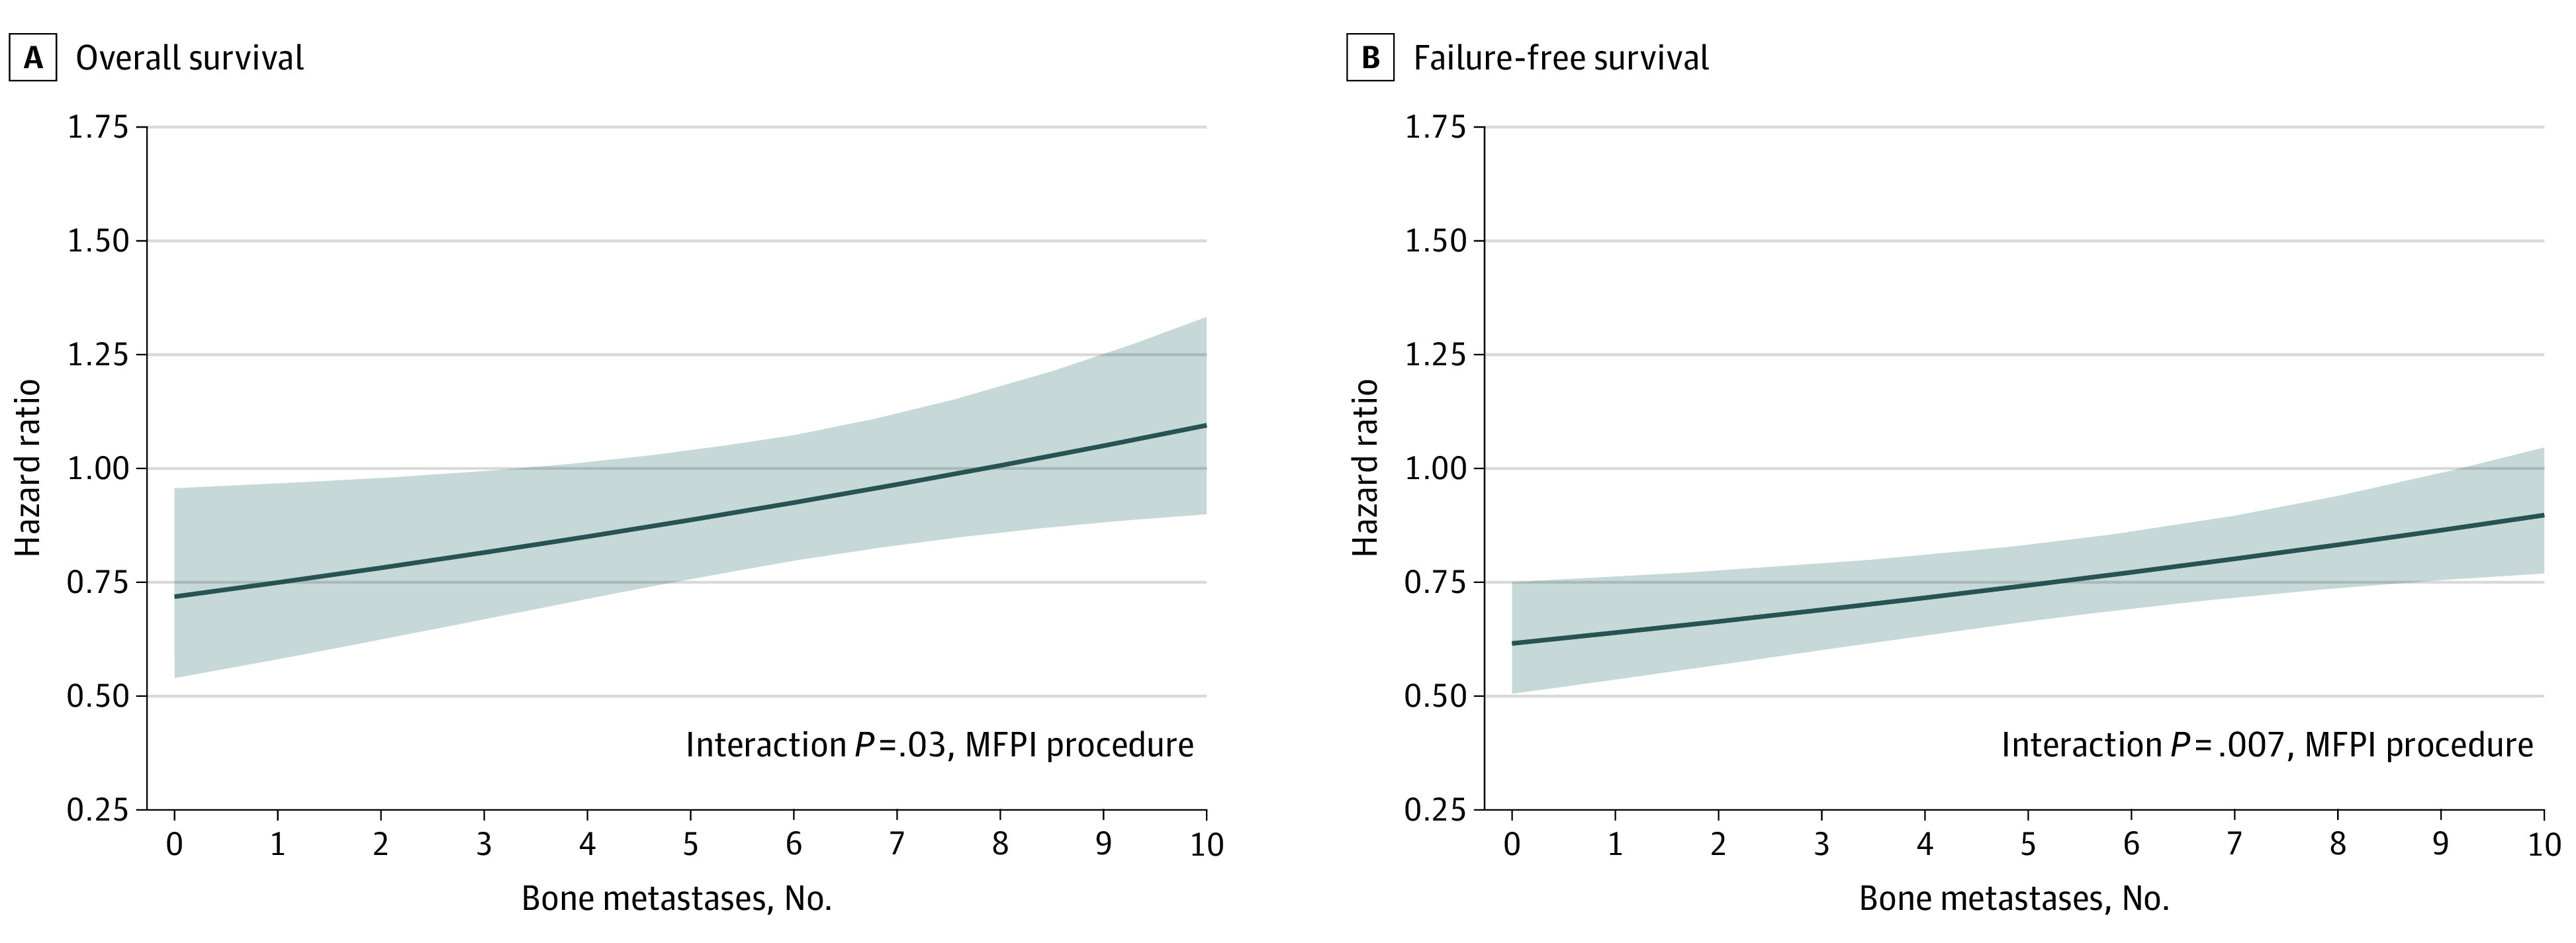
Estimated treatment effect (solid line) with pointwise 95% CI (shaded area) is shown for overall survival (A) and failure-free survival (B). The horizontal gray line at hazard ratio 1.00 denotes equivalence of treatment effects, with values below 1.00 favoring prostate radiotherapy. MFPI indicates multivariable fractional polynomial interaction.