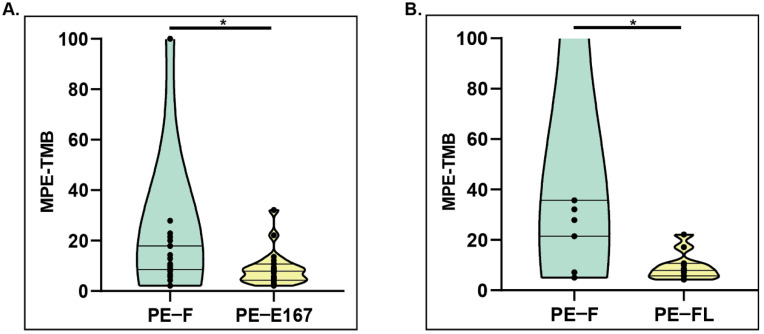
Figure 3.
Comparing TMB distribution among various sample types. A. PE-TMB was calculated using the plasma bTMB algorithm. The TMB calculated from PE-F were significantly higher than that calculated from PE-E167, *p < 0.05. B. The TMB calculated from PE-F were significantly higher than that calculated from PE-FL, *p < 0.05.

