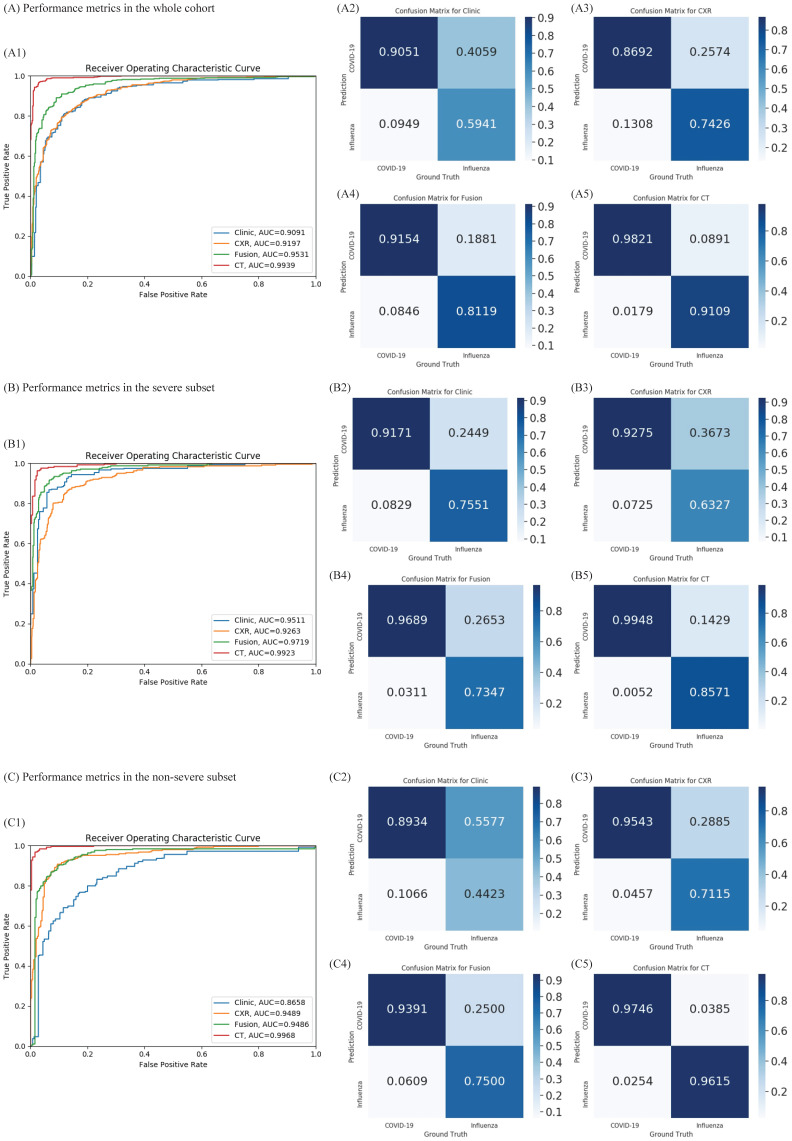
Figure 2.
Diagnostic performance of the proposed classifiers in the whole cohort, non-severe subset, and severe subset. (A) Diagnostic performance in the whole cohort. According to the receiver operating characteristic (ROC) curves of our proposed method in the whole cohort (A1), combining the chest x-ray (CXR) and clinical data (green) improves the performance compared to both individually (blue and orange). A2-A5: Confusion metrics for clinical only (A2), CXR only (A3), combined (A4), and computed tomography (CT) (A5). Both the CXR and clinical data can diagnose coronavirus disease 2019 (COVID-19) and influenza. While the accuracy for diagnosing influenza using clinical features is relatively low and that for COVID-19 using CXR is lower, combining the clinical features and CXR improves both. (B) Diagnostic performance in the non-severe subset. As shown in the ROC curves for the non-severe subset (B1), clinical data (blue) perform better than chest x-ray (CXR) (orange). B2-B5: confusion metrics for clinical only (B2), CXR only (B3), combined (B4), and CT (B5) in non-severe patients. Combining the CXR and clinical data improves the diagnostic accuracy of COVID-19; although the diagnostic accuracy for influenza is slightly lower than with the clinical features only, the overall area under the curve is improved in the combined method. (C) Diagnostic performance in the severe subset. As presented in the ROC curves for the severe subset (C1), the diagnostic accuracy of CT outperformed the clinical feature or CXR. The area under the curve of the combined method is no better than for CXR only (p = 0.46). C2-C5: The confusion metrics for clinical only (C2), CXR only (C3), combined (C4), and CT (C5). AUC: area under the receiver operating curve.

