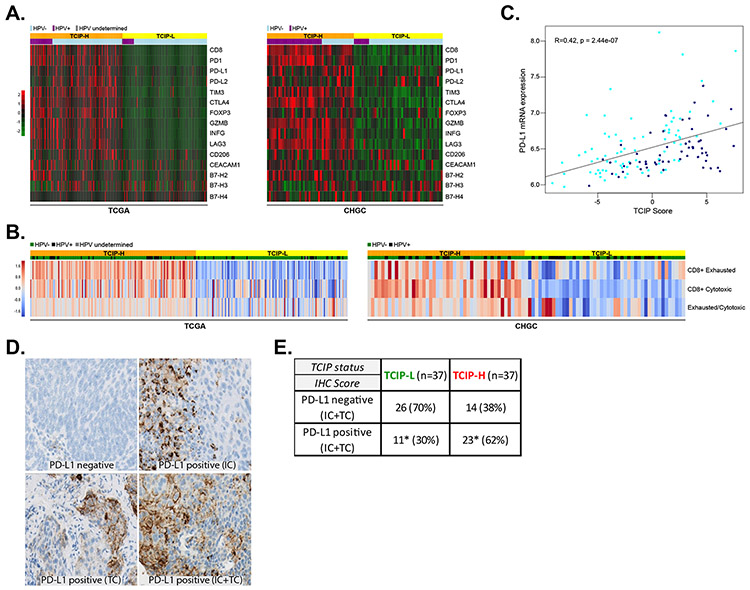
Figure 3. Correlation of immune checkpoints and immune cell markers with T-cell-inflamed phenotypes.
(A) The 12-chemokine gene expression signature was interrogated across the TCGA and CHGC cohorts and immune checkpoints PD-L1, PD-L2, B7-H2, B7-H3, B7-H4, PD-1, CTLA4, TIM3, CEACAM1 and LAG3 are presented in a supervised analysis in a heatmap. Immune cell markers CD8, CD206 and FOXP3, as well as GRZB and INFG are also presented. Orange: TCIP-H tumors, yellow: TCIP-L tumors, light blue: HPV-negative, violet: HPV-positive. (B) Relative abundance of the CD8+ T-cell subtypes (cytotoxic and exhausted) was estimated from bulk RNA-Seq data by mathematical deconvolution using iPANDA algorithm (units on the color bar represent iPANDA score for corresponding gene set). The exhausted/cytotoxic CD8+ T-cell ratios were calculated to serve as numerical surrogates of the relative infiltration of tumors with different subsets of CD8+ T-cells. (C) Correlation between PD-L1 mRNA expression and TCIP score in SCCHN tumors (CHGC) (Pearson’s correlation coefficient R=0.42, p=2.44×10⁻⁷). (D) Immunohistochemistry for PD-L1 in SCCHN tumors. Examples of PD-L1 negative SCCHN tumor, a tumor with PD-L1 positive immune cells (IC), a tumor with PD-L1 positive tumor cells (TC) and a tumor with PD-L1 positive immune and tumor cells (IC and TC). (E) PD-L1 IHC (IC+TC) and correlation with TCIP phenotypes. TCIP-H tumors were more frequently PD-L1 positive (62%), though 38% of them were PD-L1 negative. 30% of TCIP-L tumors were PD-L1 positive (Fisher’s exact test, * signifies compared percentages, p=0.009).

