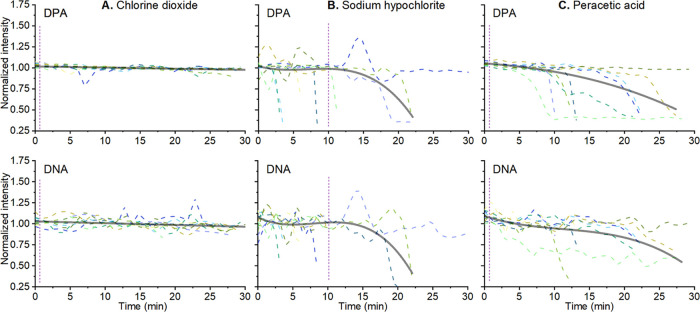
Figure 3.
Change in the normalized intensity of the Raman (smoothed using Loess smoothing) peak associated with DPA (1017 cm–1) and DNA (cm–1) of single B. thuringiensis spores (n = 10 for each panel). (A) Spores were treated with 0.075% chlorine dioxide (B), 0.5% sodium hypochlorite (C), and 1% peracetic acid. The solid gray lines are averages of all data. Vertical purple lines indicate the time for a minimum 3 log reduction in viable spores.

