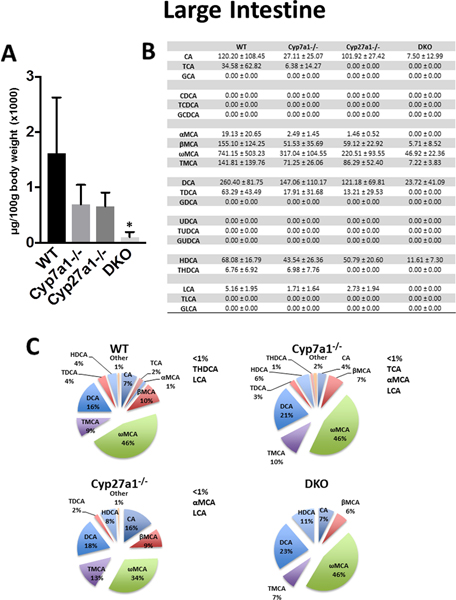
Fig. 5. Large intestine BA pool size and composition of male WT, Cyp7a1−/−, Cyp27a1−/−, and DKO mice.
(A) Large intestine BA pool size was measured using UPLC-ITMS and includes luminal content. Values are displayed in μg/100g body weight (x1000) ± 1 SD. An asterisk denotes a significant difference from WT (P < 0.05). (B) Large intestine concentration of individual BA species (μg/100g body weight) ± 1 SD. (C) Percent composition of BA species in the large intestine. BAs that represent <1% of total BAs in the large intestine are represented as “other” and denoted alongside the pie charts.

