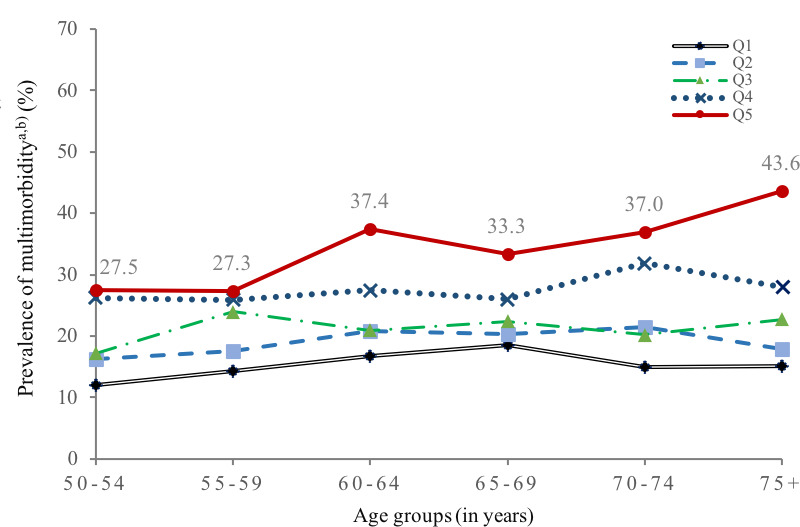
Figure 1.

Prevalence of multimorbidity by age group and per capita household expenditure. aRespondents who reported that they had two or more chronic conditions related to non-communicable diseases. bPooled sample of Wave 4 and Wave 5. Q1–Q5 refer to household expenditure quintiles, where Q1 is the lowest and Q5 the highest household expenditure quintile.
