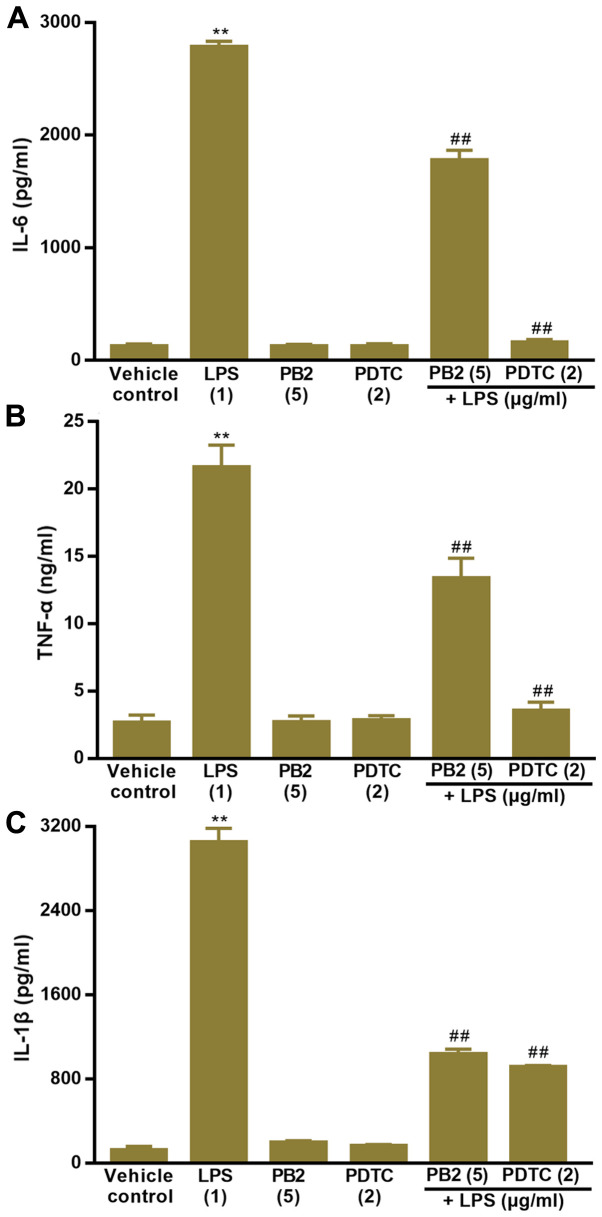
Figure 5.
Effect of LPS, PB2 and PDTC on the protein expression levels of inflammatory cytokines in HUVECs. Cells were treated with serum-free medium for 24 h in the vehicle control group; cells were treated with serum-free medium for 12 h followed by LPS (1 µg/ml) for 12 h in the LPS group; cells were treated with serum-free medium for 12 h followed by PB2 (5 µg/ml) for 12 h in the PB2 group; cells were treated with serum-free medium for 12 h followed by PDTC (2 µg/ml) for 12 h in the PDTC group; cells were treated with PB2 (5 µg/ml) for 12 h followed by LPS (1 µg/ml) for 12 h in the LPS + PB2 group; cells were treated with PDTC (2 µg/ml) for 12 h followed by LPS (1 µg/ml) for 12 h in the LPS + PDTC group. (A) IL-6, (B) TNF-α and (C) IL-1β protein expression levels in HUVECs were detected by performing ELISAs. Data are presented as the mean ± SD of at least three independent experiments run in triplicate (n=3). Data were analysed using one-way ANOVA followed by Tukey's post hoc test. **P<0.01 vs. vehicle control; ##P<0.01 vs. LPS. LPS, lipopolysaccharide; PB2, procyanidin B2; PDTC, pyrrolidinedithiocarbamate ammonium; HUVEC, human umbilical vein endothelial cell.

