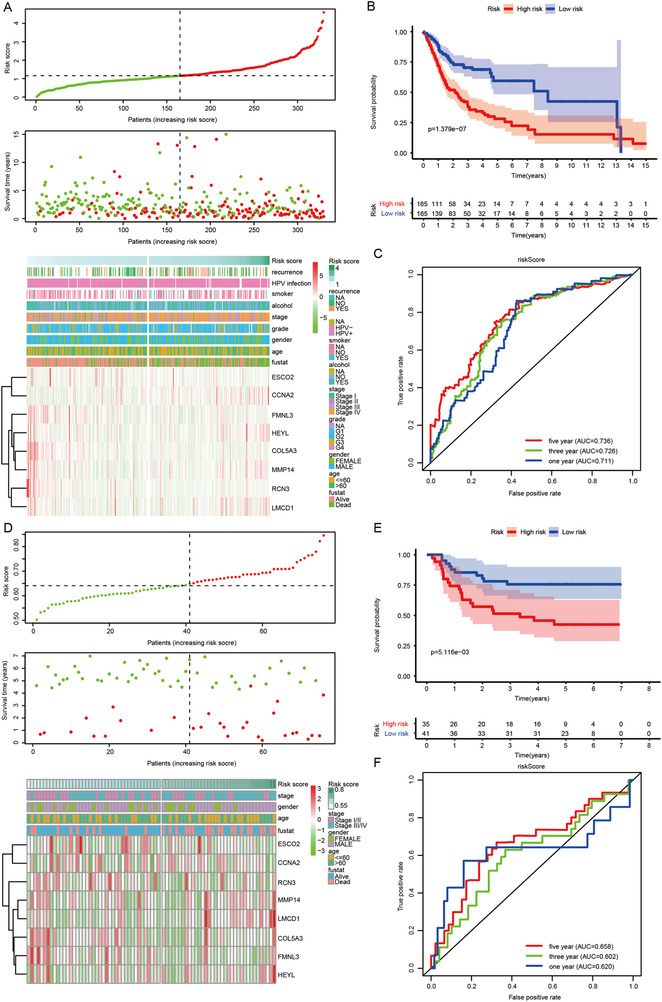
FIGURE 1.

Establishment and confirmation of an eight‐gene risk model and its predictive performance for oral cancer patients. (A) The global overview of risk score, survival status, and gene expression pattern in the TCGA training cohort. (B) Kaplan–Meier curve of the correlation between risk score and overall survival of oral cancer patients in the TCGA training cohort. (C) The ROC curves show the performance of the risk model for predicting overall survival at 1, 3, and 5 years in the TCGA training cohort. (D) The global overview of risk score, survival status, and gene expression pattern in GEO validation cohort. (E) Kaplan–Meier curve of the correlation between risk score and overall survival of oral cancer patients in GEO validation cohort. (F) The ROC curves show the performance of the risk model for predicting overall survival at 1, 3, and 5 years in the GEO validation cohort. GEO: Gene Expression Omnibus; TCGA: The Cancer Genome Atlas
