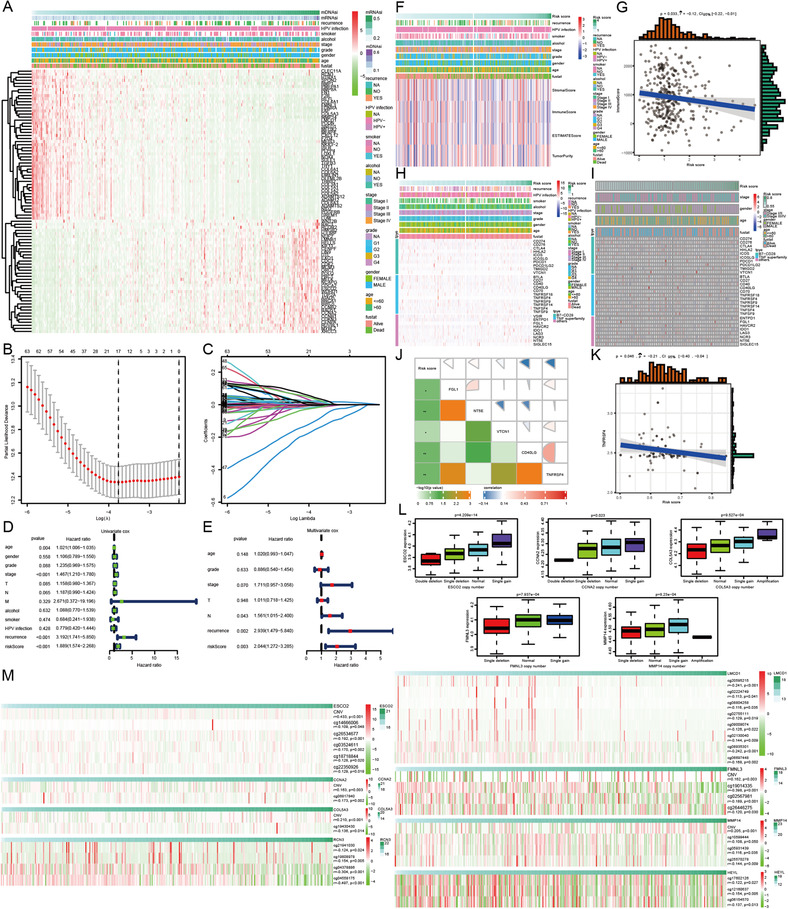
FIGURE 4.

The connection among oral cancer patients’ survival, immune score and immune checkpoint molecules, and risk score calculated by the eight‐gene signature whose expression was affected by DNA copy number variation and DNA methylation in oral cancer. (A) The expression patterns of 86 immune genes significantly correlated with stemness index. (B) Tuning parameter selection using 10‐fold cross‐validation in LASSO regression analysis. (C) Coefficient profiles of the prominent prognostic genes in LASSO regression analysis. (D) Forest plot displaying the role of clinicopathological parameters and risk score for predicting oral cancer patients’ survival in the univariate Cox proportional hazard regression model. (E) Forest plot displaying the role of clinicopathological parameters and risk score for predicting oral cancer patients’ survival in the multivariate Cox proportional hazard regression model. (F) The link between risk score and scores calculated by estimate algorithms in the TCGA training cohort. (G) The correlogram displaying the negative relationship between risk score and immunescore in the TCGA training cohort. (H and I) The expression profiles of 30 immune checkpoint molecules in patients with low‐ and high‐risk scores in TCGA training and GEO validation cohorts, respectively. (J and K) The correlograms of the relationship between risk score and immune checkpoint molecules in TCGA training and GEO validation cohorts, respectively. (L) Differential expression of five key genes in SIBS in oral cancer patients with a different type of DNA copy number variation. (M) The relationship between DNA copy number variation and DNA methylation of key genes in SIBS and the expression of their corresponding genes. GEO: Gene Expression Omnibus; LASSO: least absolute shrinkage and selection operator; SIBS: stemness‐related and immune gene set‐based signature; TCGA: The Cancer Genome Atlas
