
FIGURE 4.
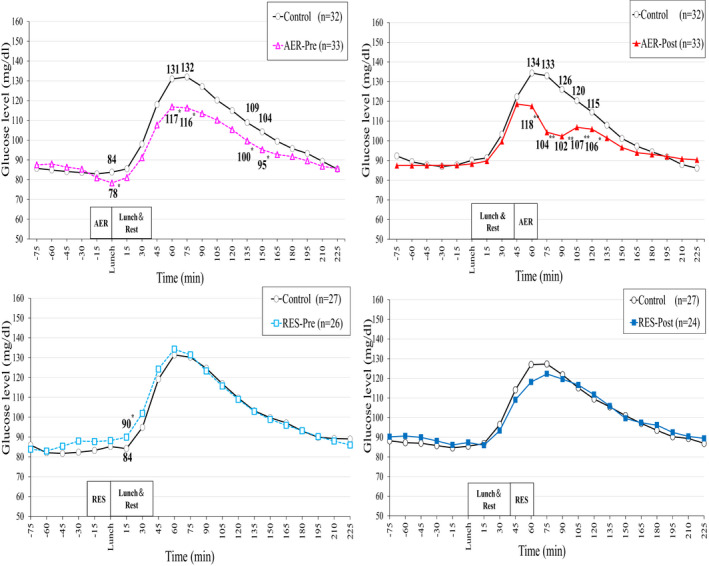
Comparison of glucose levels over time based on the type of exercise. The comparison of the values of control and each exercise over time. The 15‐minute interval is the time of recording FGM. Wilcoxon signed‐link test. *P < .05, **P < .01
Official websites use .gov
A
.gov website belongs to an official
government organization in the United States.
Secure .gov websites use HTTPS
A lock (
) or https:// means you've safely
connected to the .gov website. Share sensitive
information only on official, secure websites.
Comparison of glucose levels over time based on the type of exercise. The comparison of the values of control and each exercise over time. The 15‐minute interval is the time of recording FGM. Wilcoxon signed‐link test. *P < .05, **P < .01