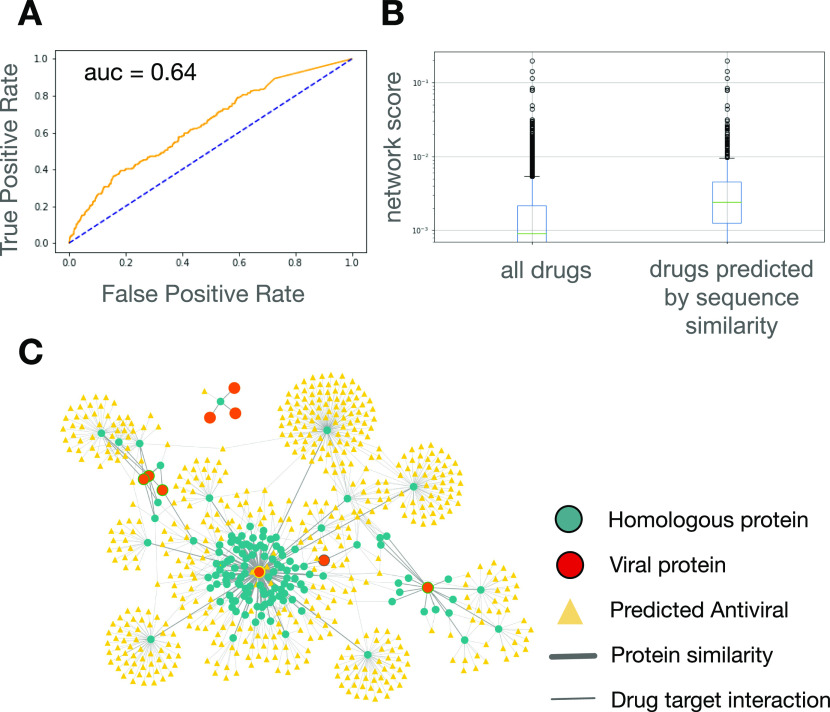
Figure 3. Method implementation on SARS-CoV-2.
(A) Receiver operating characteristic curve evaluating predictive power of network-based approach in ranking drugs currently under investigation for COVID-19 in clinical trials. (B) Box and whisker plot of network mean scores generated for all drugs with a non-zero value and for drugs identified by the sequence similarity approach. (C) Visualization of predicted antiviral drugs and SARS-CoV-2 Protein Data Bank structures on the virus–host–similarity interaction network.

