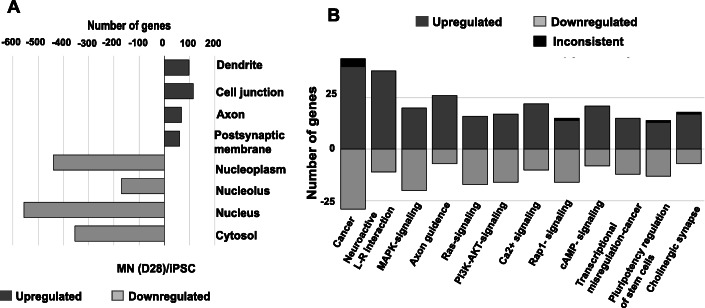
Fig. 4.
Bioinformatics analysis of transcriptomic data. a Gene ontology (GO) analysis of iPSCs and MNs as determined by the NCBI Database for Annotation, Visualization and Integrated Discovery (DAVID). The top four significant GO terms of upregulated and downregulated genes are listed, ranked by p-value, when comparing D0 iPSCs and D28 MNs. b OPaver analysis of 12 KEGG pathways ranked by the number of DEG during the chemical reprogramming of iPSCs into MNs: Pathways in cancer; Neuroactive ligand-receptor interaction; MAPK-signaling pathway; Axon guidance; Ras signaling pathway; PI3K-Akt signaling pathway; Calcium signaling pathway; Rap1 signaling pathway; cAMP signaling pathway; Transcriptional mis-regulation in cancer; Singling pathways regulating pluripotency of stem cells; and Cholinergic synapse

