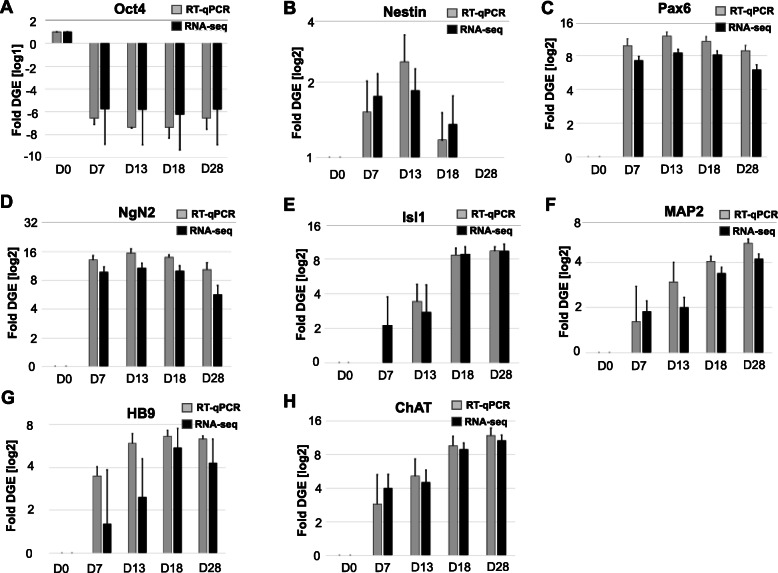
Fig. 6.
Comparative analysis of differential gene expression of key tissue development markers by RT-qPCR (gray) and RNA-seq (black). Pluripotency and NSC markers validated include (a) Oct4, transcription factor that maintains self-renewal and pluripotency; (b) Nestin, a filament protein marker of neural stem cells; (c) Pax6, a transcription factor that drives neurogenesis; and (d) NgN2, a neuronal-specific transcription factor. Motor neuron specification markers validated include (e) Isl1, a transcription factor required for motor neuron generation; (f) Map2, a neuron-specific cytoskeletal protein; (g) HB9, an early marker of cholinergic neurons; and (h) ChAT, an enzyme required for acetylcholine synthesis. Shown are the averages and standard error from three independent biological replicas from the iPSC to MN differentiation trajectory. The RNA-Seq transcripts were normalized to the total read per analyzed sample (in FPKM: fragments per kilobase per million mapped fragments) and the transcript levels determined by RT-qPCR were normalized to GAPDH as the endogenous sample control. Fold change was calculated for each developmental stage relative to transcript levels in iPSC (D0). Statistical significance (p < 1.5e-6) was determined with Student t-test

