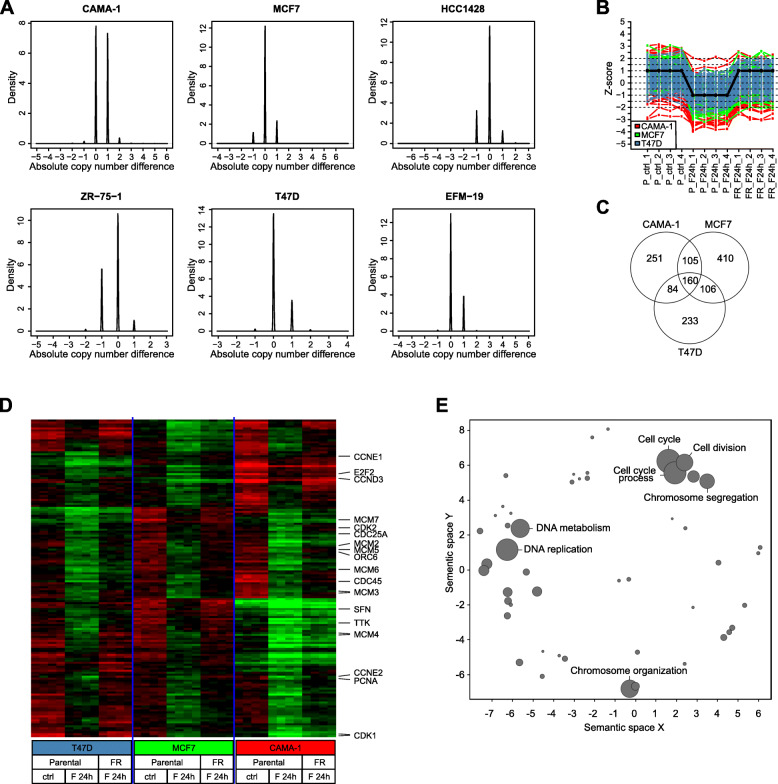
Fig. 4.
Fulvestrant-resistant models show differences in genomic regulation but similarities in transcriptional output. a Histograms of the difference in copy number estimates between fulvestrant-resistant and corresponding parental cell lines for all six models analyzed by Illumina GSA arrays. If no difference exists between cell lines, the histogram would show one narrow spike at 0. Observation of smaller subpopulations of SNP probes with difference in copy number between resistant and parental cells indicates that copy number alterations have occurred. BAF and LogR files are shown in Additional file 7. b Graphical illustration of pattern correlation analysis identifying genes that are downregulated in parental cells upon treatment with 100 nM fulvestrant for 24 h, and then upregulated upon development of fulvestrant resistance. c Venn diagram of genes following this pattern. One hundred sixty genes were found significant across CAMA-1, MCF7, and T47D models. d Gene expression heatmap of 160 genes (rows) found to be significant based on correlation and expression variance cutoffs in the pattern correlation analysis in all three cell lines. Samples (columns) are ordered by (i) cell line, (ii) treatment type (parental control, parental with 24 h fulvestrant treatment (F 24 h), and resistant (FR, F 24 h)), and (iii) biological replicate. Green corresponds to decreased expression (lower limit − 1.5 in expression) and red to increased expression (upper limit 1.5 in expression). Eighteen genes present in the KEGG pathway “Cell cycle” are indicated to the right. All 160 genes are listed in Additional file 1. e To determine commonly enriched processes, the list of 160 identified genes was subjected to gene ontology annotation using the DAVID bioinformatics tool (see also Additional file 8). Data were visualized using the REVIGO web server. Data are displayed on the x- and y-axis based on semantic similarity; hence, more similar GO terms cluster more closely together. The size of each node represents the log10 p value of enrichment, the larger the node, the smaller the p value, and the more significant the enrichment. Most significantly enriched processes are presented

