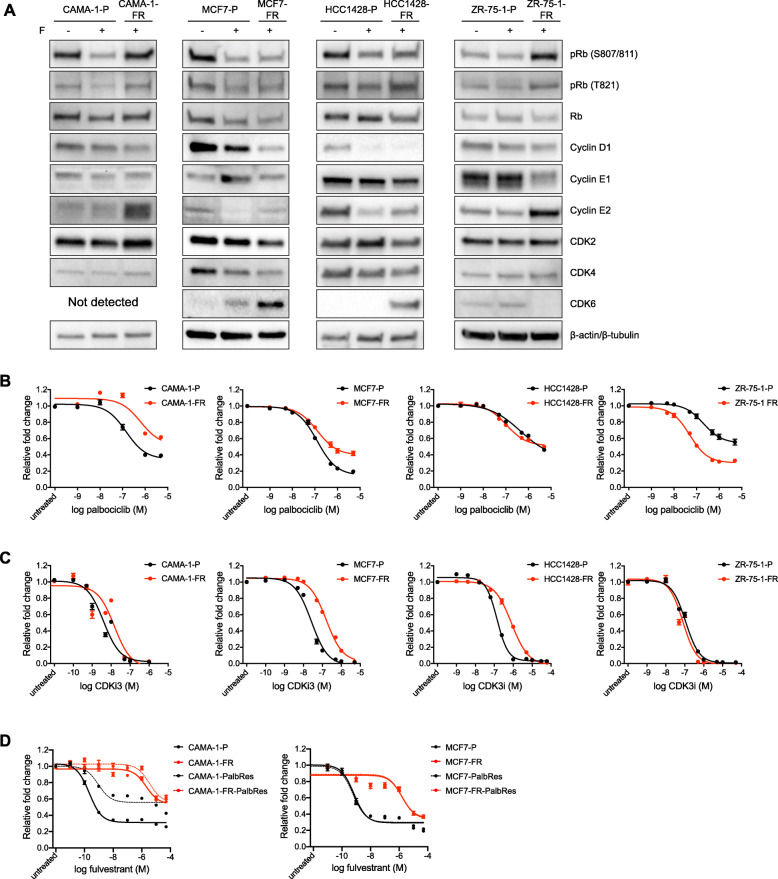
Fig. 5.
Fulvestrant-resistant models present differential regulation of cell cycle proteins and different sensitivity to CDK inhibition. a Western blotting for expression of cell cycle regulating proteins in parental and fulvestrant-resistant CAMA-1, MCF7, HCC1428, and ZR-75-1 cells after treatment for 24 h with 100 nM fulvestrant (+F) or DMSO control (-F). Representative data from three biological replicates. β-actin (CAMA-1, MCF7, and ZR-75-1) or β-tubulin (HCC1428) were used as loading control. Quantification of band intensities is presented in Additional file 4H-K. Data for the T47D and EFM-19 models are shown in Additional file 9B. b, c Dose-response curves for parental and fulvestrant-resistant CAMA-1, MCF7, HCC1428, and ZR-75-1 cells in response to 6-day treatment with increasing concentrations of the CDK4/6 inhibitor palbociclib (1 nM to 5 μM) (b) or a CDK1/2 inhibitor (CDKi3, 100 pM to 50 μM) (c). Graphs represent combined data (average ± SEM) from three biological experiments with three technical replicates each. IC50 values are shown in Additional file 9C and E. Data for the T47D and EFM-19 models are shown in Additional file 9D and F. d Dose-response curves for parental (-P, black solid lines), fulvestrant-resistant (-FR, red solid lines), palbociclib-resistant (-PalbRes, black dotted lines), and double fulvestrant- and palbociclib-resistant (-FR-PalbRes, red dotted lines) CAMA-1 and MCF7 cells in response to 6-day treatment with fulvestrant (10 pM to 50 μM). Graphs represent combined data (average ± SEM) from minimum two biological experiments with three technical replicates each. IC50 values are shown in Additional file 9J. Dose-response curves in response to palbociclib are shown in Additional file 9H

