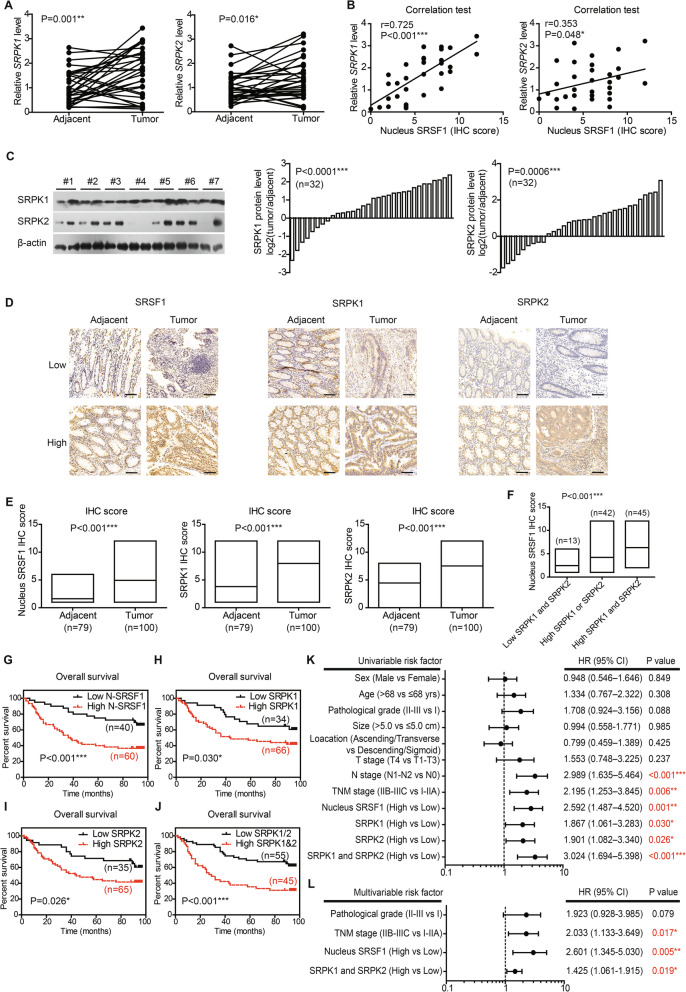
Fig. 4.
Expression and prognostic role of SRPKs in CAC. a RNA levels of upstream kinases targeting splicing factors in paired clinical specimens were tested by RT-qPCR (n = 32). P value was based on paired Student’s t-test. b Correlations between nucleus SRSF1 level and upstream kinases were analyzed via Spearman correlation test (n = 32). The nucleus SRSF1 level was scored by the specific nucleus staining of SRSF1 (ranging 0–12) without considering its cytosol staining. c Protein levels of SRPK1 and SRPK2 in paired clinical specimens were tested by western blotting (left panel). After semi-quantified, we found that 75% cases (24/32) showed increased SRPK1 in tumor tissues (middle panel), and 71.9% cases (23/32) exhibited increased SRPK2 (right panel). d Representative IHC results of SRSF1, SRPK1, and SRPK2 in specimens from validation cohort. Scale bar: 100 μm. e The different protein levels of SRPK1, SPRK2, and nucleus SRSF1 in validation cohort were exhibited by box plots according to IHC data. P value was based on unpaired Student’s t-test. f Patients with both high-SRPK1 and high-SRPK2 levels exhibited the highest nucleus SRSF1 level, while patients with low SRPK1 and low SRPK2 showed the lowest nucleus SRSF1 IHC score. P value was based on One-way ANOVA test. Kaplan-Meier survival curves showed the clinical relevance of nucleus SRSF1 (g), SRPK1 (h), and SRPK2 (i) in validation cohort of CAC patients, respectively. Furthermore, the higher expression of both SRPK1 and SRPK2 showed a more significant role on indicating poorer overall survival (j). Forest plots summarized the significant prognostic factors by univariate (k) and multivariate (l) analyses, the corresponding data were supplemented in Table S4 and Table S5. P value was calculated by log-rank test or Cox-regression test

