
Fig. 4.
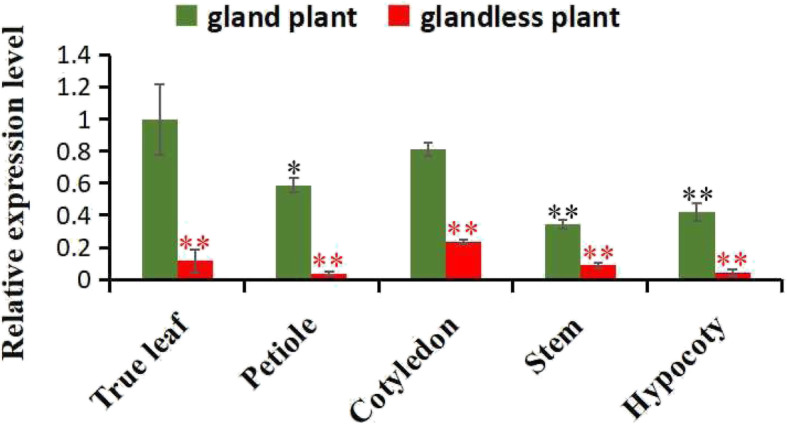
Spatiotemporal expression analysis of GhERF105 gene in different organs of glanded plant and glandless plant. The experiment was performed using three biological replicates, statistical significance was analyzed using a Student’s t-tests (*P < 0.05, **P < 0.01). Error bars represent the standard of the mean values of three biological replicates. Red symbol ‘*’ indicates the expression of GhERF105 was significant difference in the same organ between glanded and glandless cultivars, Black symbol ‘*’ indicates the expression of GhERF105 was significant difference in the different tissues of glanded cultivars