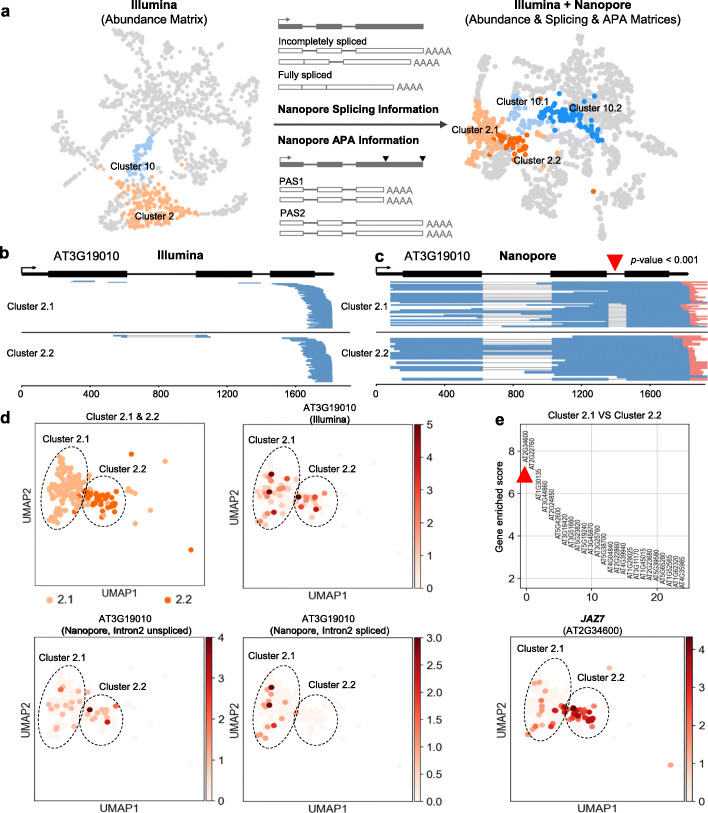
Fig. 4.
Nanopore long-read single-nucleus RNA-seq improves cell type identification. a Multilayer matrices combining Illumina abundance matrix with Nanopore splicing and APA information improve cell type identification. b, c Genome-browser plot of Illumina reads (b) and Nanopore reads (c) aligned to gene AT3G19010. The second intron of AT3G1910 shows different splicing patterns between cluster 2.1 and cluster 2.2. The red arrowhead indicates the second intron. Differences in splicing patterns between two clusters were tested using Fisher exact test, and the corresponding p value is lower than 0.001. The red bar at the 3′ end of Nanopore reads (blue) indicates the Poly(A) tail. d UMAP visualization shows the abundance distribution of AT3G19010 as well as the differential splicing of the second intron between cluster 2.1 and cluster 2.2. e The top 25 genes enriched in cluster 2.2 are ranked by enriched score compared to cluster 2.1 (upper panel) and UMAP visualization shows the abundance distribution of the most enriched gene JAZ7 (lower panel). The enriched score is calculated using rank_genes_groups function of Scanpy. The red arrowhead indicates the most enriched gene in cluster 2.2

