Fig. 5.
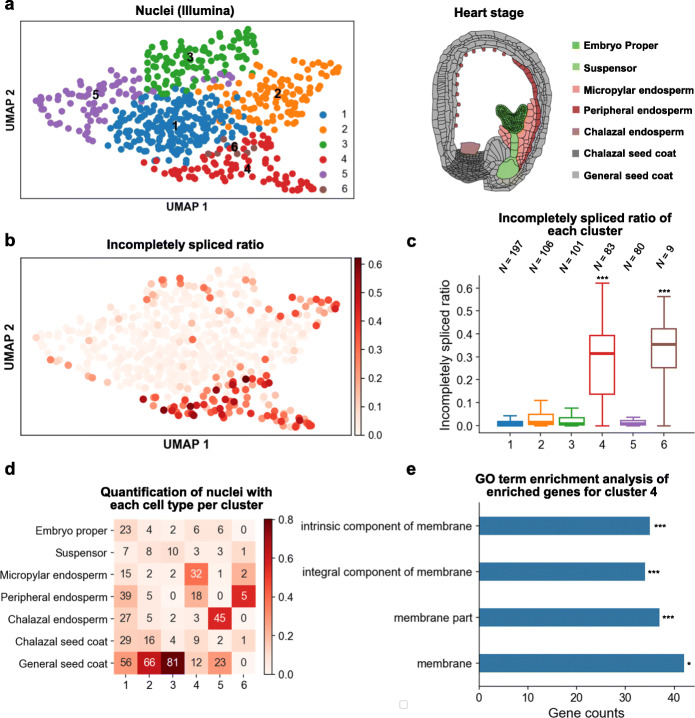
flsnRNA-seq captures the variation in intron retention levels of different clusters. a UMAP visualization of clustering result using Illumina single-nucleus data (left panel), and cartoon illustration of major cell types in Arabidopsis endosperm at heart stage (right panel). b UMAP visualization of incompletely spliced ratio calculated by Nanopore full-length reads. c Barplot visualization of the incompletely spliced ratio of each cluster. Differences in incompletely spliced ratios between each cluster to all other clusters were tested using a one-sided Kolmogorov-Smirnov test. “***” denotes that the p value is lower than 0.001. d Quantification of nuclei with each cell type per cluster. The number represents nucleus counts and the color represents the proportion of cell types in each cluster. e GO term enrichment analysis of all 93 enriched genes for cluster 4. Only cellular component terms are plotted. “*” and “***” denote that the adjusted p value is lower than 0.05 and 0.001, respectively

