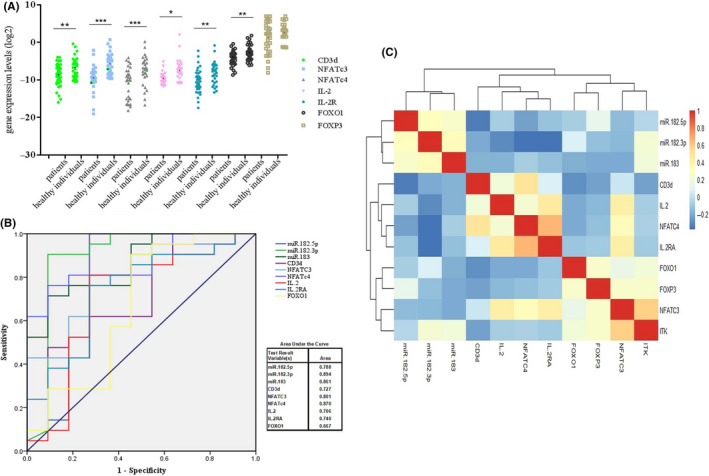
FIGURE 2.

Comparison of the targets of miR‐182 cluster expressions in peripheral blood mononuclear cells (PBMCs) between patients with breast cancer (BC) and healthy individuals. A, Variation of the miR‐182 clusters’ targets in PBMCs of patients with BC. B, Receiver operating characteristic (ROC) curve for diagnosis and prognosis of BC tissues. The areas under the curves are the gene expression level of miR‐182‐5p, miR‐182‐3p, miR‐183, CD3d, NFATC3, NFATc4, IL‐2, IL‐2RA, and FOXO1 in PBMCs of BC patients as compared with PBMCs of healthy individuals. C, Hierarchical clustering analysis showing the relationship between expression variation of miR‐182‐5p/‐3p, miR‐183, CD3D, ITK, NFATc3, NFATc4, IL‐2, IL‐2RA, FOXO1, and FOXP3 in PBMCs of patients with BC
