FIGURE 6.

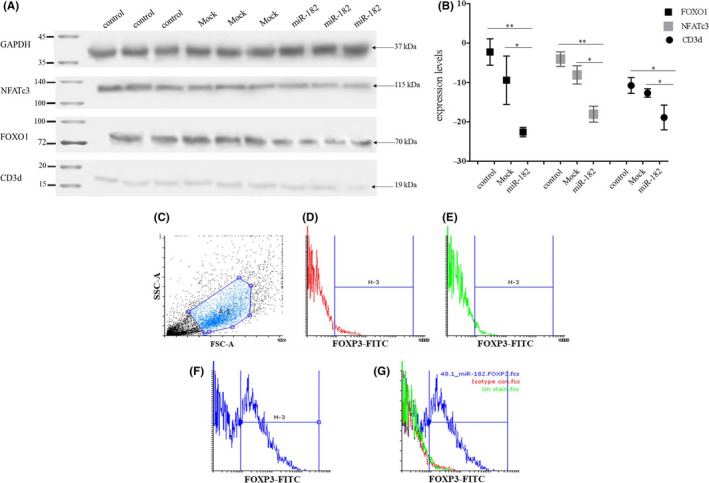
Effects of miR‐182 overexpression on NFATc3, FOXO1, and CD3d expression and FOXP3+ Tregs population differentiation. (A) Western blotting assay shows reduction of NFATc3, FOXO1, and CD3d by miR‐182 in Jurkat cells. B, Quantification: The intensity of each band using ImageJ confirms reduction of NFATc3, FOXO1, and CD3d by miR‐182 in Jurkat cells. In addition, comparison of NFATc3, FOXO1, and CD3d expression levels in the miR‐182–transduced group with mock and nontreated control groups. C, Graph of the cell population by using FSC‐A versus SSC‐A plot on unstained control group (mock). D, Isotype control group. E, Fluorescent intensity in the stained control group (mock). F, Fluorescent intensity in the stained group transduced by miR‐182. G, Comparison of overlaid and comparison of FOXP3 expression between the miR‐182 transduced group and both mock and isotype control groups. Anti‐FOXP3‐FITC; FSC‐A: forward scatter‐A; SSC‐A: side scatter‐A. Data represent mean ± SD (error bars) of three independent experiments in duplicate (***P < .001, **P < .01 and *P < .05)
