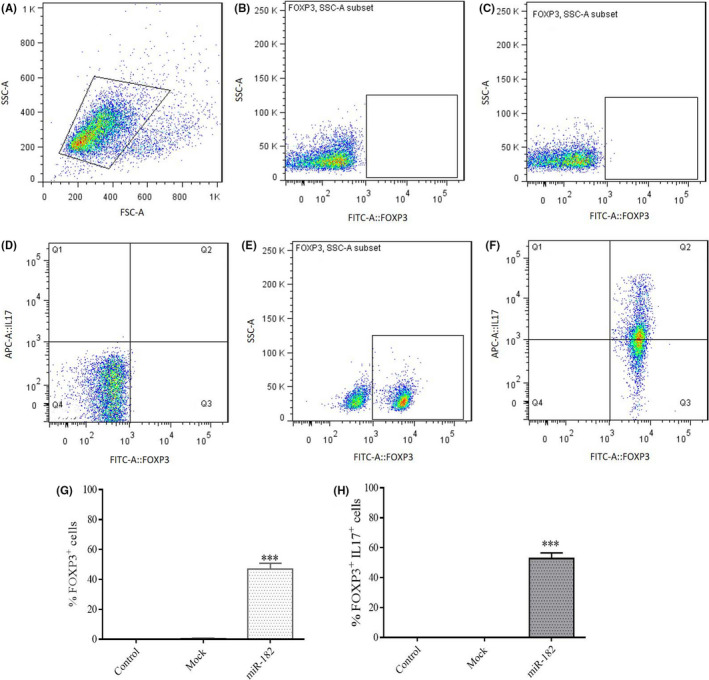
FIGURE 7.

Effects of miR‐182 overexpression on intracellular expression of FoxP3 and IL‐17. A, Graph of the cell population by using FSC‐A versus SSC‐A plot in unstained control group stimulated with PMA/ionomycin and brefeldin A. B, FOXP3+ population in unstained control group stimulated with PMA/ionomycin and brefeldin A that was stained for intracellular FOXP3. C, FOXP3+ population in mock control group stimulated with PMA/ionomycin and brefeldin A that was stained for intracellular FOXP3. D, Quadrant showing the population of FOXP3‐IL17+ T cells (Q1), FOXP3+IL17+ T cells (Q2), FOXP3+IL17‐ T cells (Q3), and FOXP3‐IL17‐ T cells (Q4) in the control group (mock) stimulated with PMA/ionomycin and brefeldin A that was stained for intracellular FOXP3 and IL‐17. E, Population of cells transduced by miR‐182 that expressed intracellular FOXP3. F, Population of cells transduced by miR‐182 and stimulated with PMA/ionomycin and brefeldin A that was stained for intracellular FOXP3 and IL‐17. G, Percentage of FOXP3+ T cells after transduction by miR‐182 and stimulation with PMA/ionomycin and brefeldin A that was stained for intracellular FOXP3 and IL‐17. H, Percentage of FOXP3+ IL17‐producing T cells after transduction by miR‐182 and stimulation with PMA/ionomycin and brefeldin A that were stained for intracellular FOXP3 and IL‐17 (***P < .001). FSC‐A, forward scatter‐A; SSC‐A, side scattering; FITC‐A::FOXP3, Anti‐FOXP3‐FITC‐A; APC‐A::IL‐17, Anti‐IL‐17‐APC‐A
