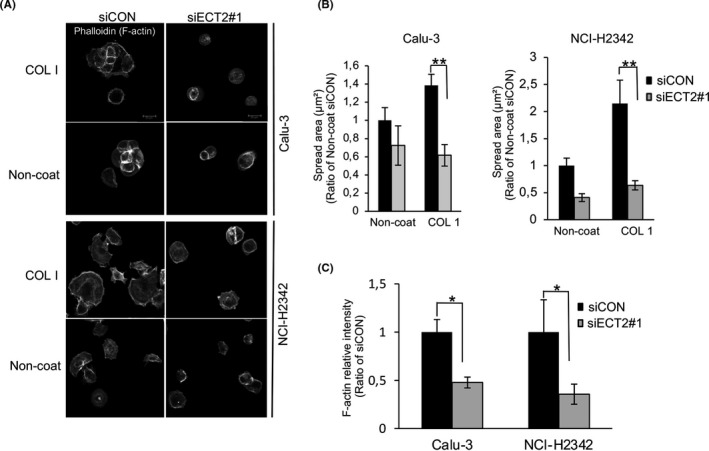
FIGURE 3.

Changes of morphology and actin organization in epithelial cell transforming sequence 2 (ECT2)‐depleted cells. A, Confocal images of Calu‐3 and NCI‐H2342 cells transfected with siECT2#1 or siCON and then left to spread on COLl or noncoated coverslips for 12 h, Scale bar 20 μm. B, The area of spread of transfected cells was analyzed and quantified from three images using ImageJ software. Error bars represent mean ± SD, n = 3. C, Histogram shows fluorescence intensity measurement of F‐actin after transfection with siECT2#1 compared with siCON at 12 h post plating on COL1. Error bars represent mean ± SD, n = 3, *P < .05, **P < .01
