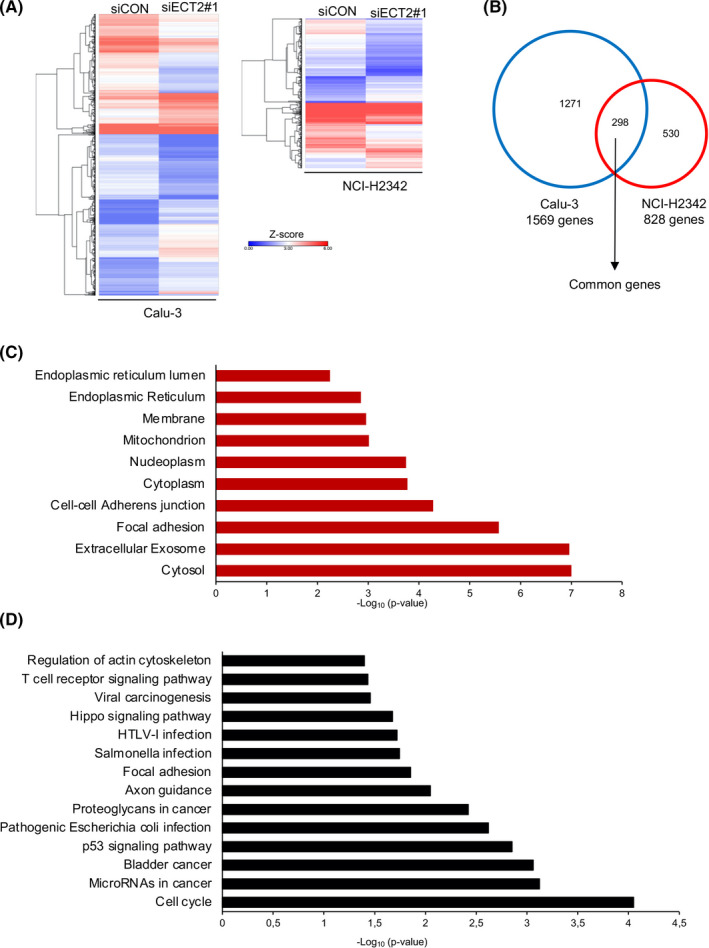
FIGURE 4.

RNA‐seq profiling of epithelial cell transforming sequence 2 (ECT2) silencing in lung adenocarcinoma (LAC) cells. A, Clustered heatmap shows a total of 1569 and 828 differentially expressed genes for Calu‐3 and NCI‐H2342 cells, respectively. Data represent n = 1 sample per condition. B, Venn diagram showing the overlap between genes differentially expressed in Calu‐3 and NCI‐H2342 cells; 298 genes were defined as common to both cell lines. C, Gene Ontology (GO) terms enrichment analysis of common genes showing the top 10 significantly enriched cellular component terms. D, KEGG pathway enrichment analysis of common genes. Significant enrichment of KEGG pathways was defined as P < .05 and more than five genes
