
FIGURE 2.
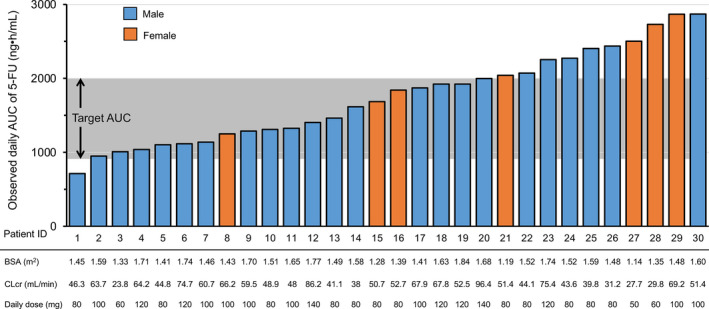
Observed daily area under the concentration‐time curve (AUC) of 5‐FU. Body surface area (BSA), creatinine clearance estimated by the Cockcroft‐Gault equation (CLcr), and daily dose in each of the 30 patients
Official websites use .gov
A
.gov website belongs to an official
government organization in the United States.
Secure .gov websites use HTTPS
A lock (
) or https:// means you've safely
connected to the .gov website. Share sensitive
information only on official, secure websites.
Observed daily area under the concentration‐time curve (AUC) of 5‐FU. Body surface area (BSA), creatinine clearance estimated by the Cockcroft‐Gault equation (CLcr), and daily dose in each of the 30 patients