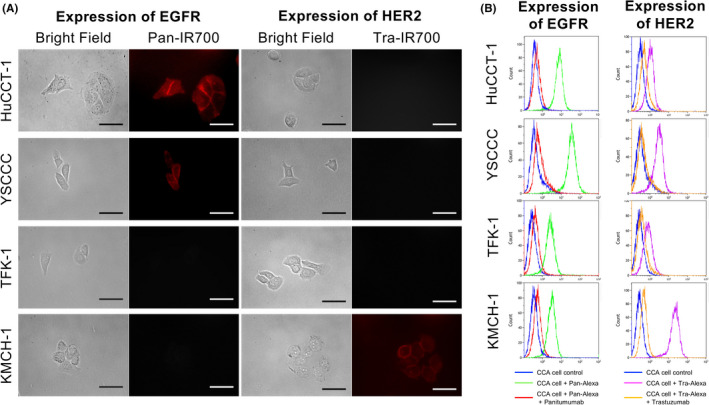
FIGURE 2.

In vitro expression of EGFR and HER2 on CCA cells. A, Fluorescence microscopic images of HUCCT‐1, YSCCC, TFK‐1, and KMCH‐1 cells. All cells were pre‐incubated with Pan‐IR700 (5 µg/mL) or Tra‐IR700 (5 µg/mL) at 37°C for 1 h. Cells were then washed with PBS and IR700 fluorescence was observed. Scale bar: 50 µm (original magnification, 40×). B, Expression levels of EGFR and HER2 in HuCCT‐1, YSCCC, TFK‐1, and KMCH‐1 cells were evaluated by flow cytometry. Binding of Pan‐Alexa488 to HuCCT‐1 and YSCCC cells, and Tra‐Alexa488 to KMCH‐1 cells was blocked by adding an excess dose of unconjugated antibodies
