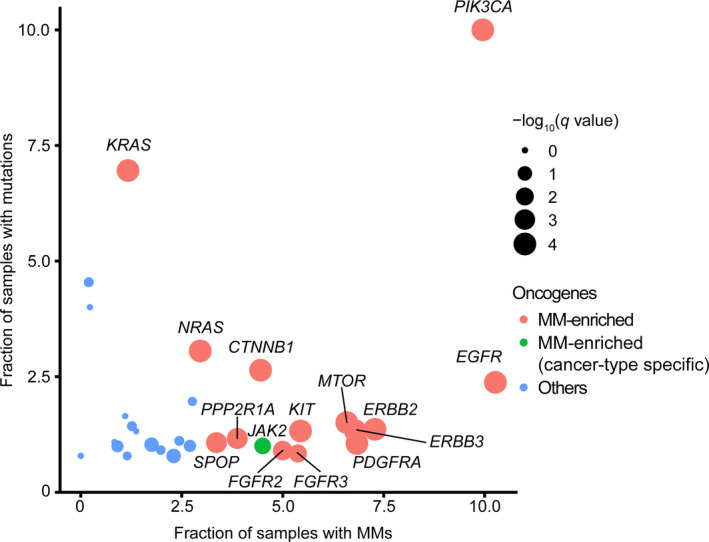
Figure 2.

The prevalence of multiple mutations (MM) across oncogenes. Fraction of samples with MM (out of the total number of mutated samples; x‐axis) and fraction of samples with mutations (y‐axis) across 30 oncogenes. Reanalysis of data from Saito et al (n = 11 043). 4 Circle sizes indicate q‐values of the permutation test. Oncogenes with significant enrichment of MM in pan‐cancer and cancer‐type‐specific manners are indicated in red and green, respectively
